Gay Pay in the USA (2011)
A throw-back Thursgay for ya, back to the wonders of my undergrad thesis! A bit out of date now, but, I still think I had some interesting findings. And I pay for the domain, so deal.
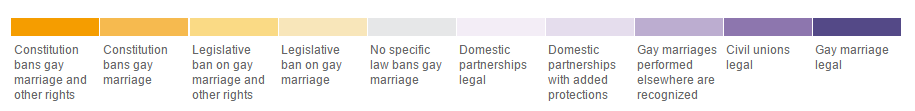
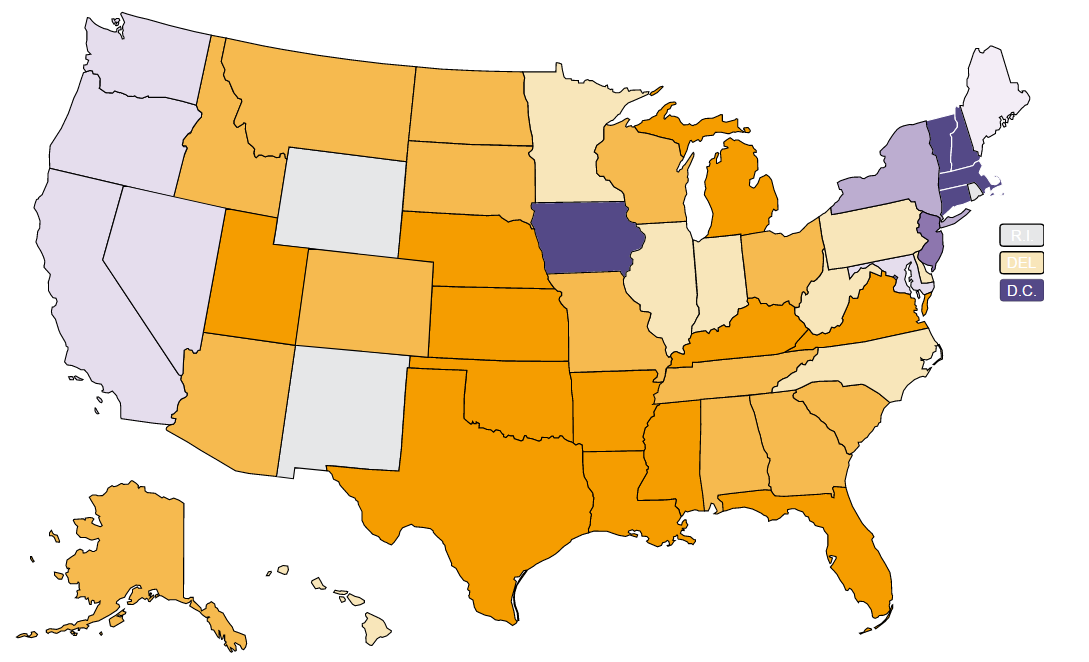
So rewind to 2010/2011. The recent Don’t Ask, Don’t Tell Repeal Act was the hot LGBT issue, giving all the homophobes a nice change of pace from complaining about how the gays ruin civilian life. Marriage laws in the U.S. were a hot mess – I’m looking at you California and your Prop. 8 flip-floppin’ nonsense. The rest of the country was an equally confusing smorgasbord of laws – only a handful of states with full marriage equality (still not sure how Iowa got in that cool club), some that only allowed civil unions (cause that’s the same), some that would recognize marriages performed by the cool states – but not allow their own, and then a whole bunch more states with differing laws banning things – banning same-sex marriages, banning gay marriages and civil unions, or banning “any marriage-like contract” (gotta cover all them bases!). Confused yet? Here’s the cliffs notes from LA Times:
Gay Marriage Laws by State, 2010
So, somewhat different political climate, but a similar environment as we see today. Very polarized camps on both sides of the issues, fueled by religious interpretation and/or personal belief, and a severe lack of research on these issues and the broader LGBTQIA+ community. I was a soon-to-be graduate up for the challenge. Senior thesis would be gay-themed, and awesome!
I soon ran into many road blocks. There was barely any large scale and reliable gay datasets available! Also, turns out it is hard to define what “homosexual” is. Self-reporting is tricky cause you have to take into account the environment respondents are being asked in – would they be comfortable disclosing personal information? Some previous studies relied on sexual behavior, which is also messy – how many same-sex sexual experiences does it take before you count someone as gay? Living arrangement is another option, but again imperfect – are they roomates or “roomates”? Who’s to say?! Even once you pick your gay-classifying poison, it is still impossible to know how “out” a person is to others and themselves and how that could affect your findings. Lastly, the existing body of research was highly biased. The only people that care enough about this stuff to devote their professional careers to it are probably gay or really hate the gays. Don’t worry though ya’ll, I’m clearly impartial..
So, to recap – I gots no data, what even is gay?, and there’s lies! Everywhere! Everyone has an agenda! Thesis is off to a fantastic start.
But, alas, I needed to graduate so you do the best you can and then write 30 pages of stuffy academic disclaimers about how all the unknown issues can make your findings complete crap. I’ll keep the crap at a minimum now though, and just present to you the awesome-ness that is:

You got it – Gay Pay in the USA! Title totally ripped off from the 2005 paper “Gay Pay in the U.K.” I had 2 burning questions :
Are there income differences between similar gay and straight individuals?
Do different state marriage laws affect the income levels of gays living in those states?
To explore, I settled on data from the 2009 American Community Survey. This allowed me to identify gay people ONLY if they reported living with a same-sex partner. The dataset had an “unmarried partner” variable, which could identify those in both same and opposite-sex cohabitating partnerships. Good enough.
So not perfect, but I had a large dataset with lots of information on gay and straight married/partnered people! I’m not one for the gender binary, but you take what you can get, and so here we have some summary stats for male and female partners, by sexual orientation.


Highlights for the men include that married men in the sample earned the most and were older. More gay males lived in urban areas and had fewer children. Nothing earth shattering. (Not sure why college me kept the percentages as decimals, sorry bout that!) For the females – gay partners made the most, which in this descriptive phase shouldn’t be surprising since many straight women stop working to raise children (yay outdated gender roles/pay gap!) We can confirm this from the table, more gay partnered females were working full-time compared to their straight married or partnered counterparts.
So summary statistics like this are interesting and give you a feel for the data, but, when you start thinking about all these other reasons things could be the way they are, it is hard to determine how much of an effect the gay actually has on these people’s finances. No worries, that is what statistical models are for! They can detangle the gay from things like children and race and location and look for the remaining signal! Pretty cool right? Lets get to it then!


Q1: Are there Income Differences between Gay and Straight Individuals?
Question 1 was mostly just to reproduce research that had been done before, like, a lot actually. Check em out:
- 1995: M.V. Badgett “Wage effects of sexual orientation discrimination”
- 2005: Arabsheibani et al “Gay pay in the UK”
- 2008: Carpenter “Sexual orientation, work and income in Canada”
- 2009: Cushing-Daniels “Wage penalties and sexual orientation”
- 2010: Ahmed “Sexual orientation and earnings”
But, I can save you some time. Despite identification, location, and data differences, almost all of the studies found the same thing – Gay women make 10-20% more than straight women, while gay men make 5-15% less, all other things held constant.
Consistent Finding in Literature
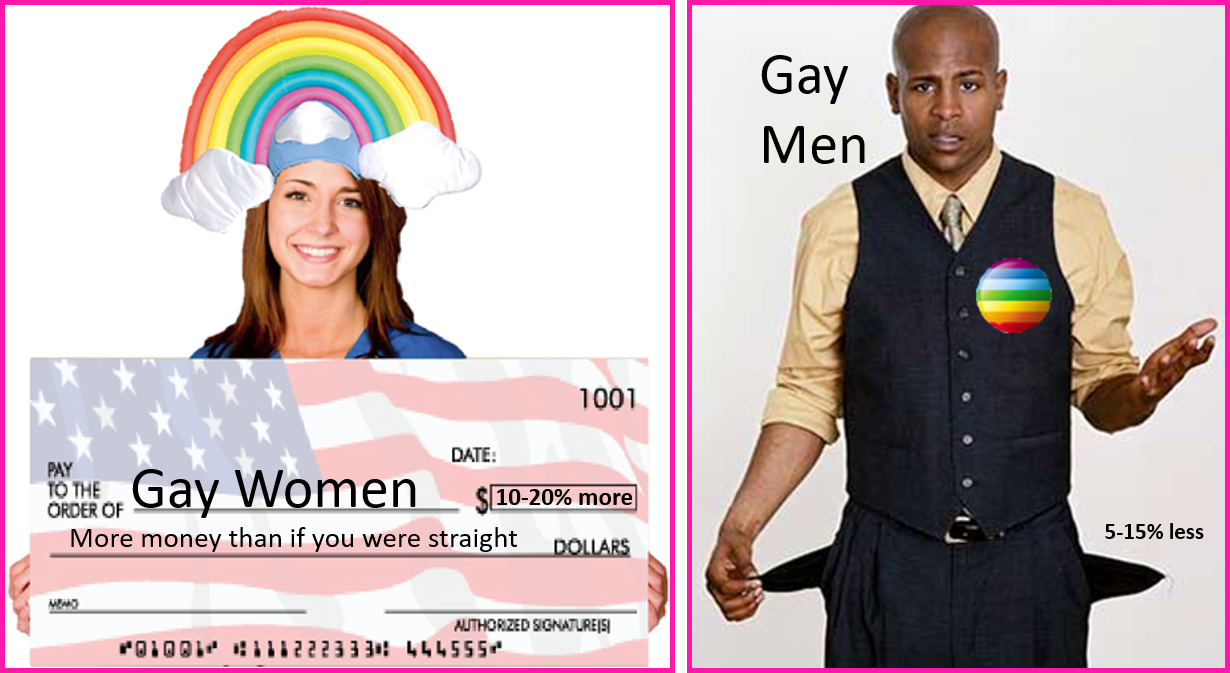
( 22 year old sleep deprived me completely lost it badly photoshopping those pictures 🙂 )
To test this consistent finding from the literature, I wanted to build my own models that looked for differences in incomes between gay and straight partnered individuals, but that wasn’t due to other things that typically affect incomes – such as age, race, sex, experience, children, occupation, etc. In nerd language that looks like this:

And this model would be run on the full dataset of married individuals as well as the opposite and same-sex partners. While it might seem natural to compare just the two unmarried partner groups, they are actually much more different. Even though they both report being unmarried partners, with the legal environment at the time, straight couples were able to chose this status while in most places the gay couples did not. The summary statistics showed the unmarried straight cohort as a younger group with lower average education levels and higher number of children than the general population. On the other hand, despite some similarities on average between gay partners and married couples, it wouldn’t be be appropriate to just compare these two groups either. You could not distinguish which gay couples would choose to marry if it were allowed and which would just remain cohabiting.
My model was similar to many of the studies in the literature, I wasn’t totally just copying though – my dataset was different (*cough* better). For example; accounting for occupational differences. This is necessary because it was reported that gay men were over-represented in lower-paying fields such as sales or service while gay women were more likely to be employed in fields such as government and manufacturing (There were numbers behind these, not just stereotypes, promise!). The other studies would take into account occupational differences, but with very broad categories such as “Health Services” or “Manufacturing”. The dataset I had was much more granular, allowing me to control for 475 detailed job categories, such as “Dental Hygienists” or “Welding, Soldering, and Brazing Workers”. This meant that I was able to compare more similar people occupation-wise, making any remaining income differences (after all the other controls) more likely to be because of their sexual orientation!
The other controls are pretty standard and widely used in studies looking at income disparities due to many factors, including gender, race, or religion. The Race control category included dummy (indicator, binary, or 0/1) variables for White, Black, Asian, and Hispanic origins. Education Level was broken down into categories for Less than a High School Education, High School Diploma or Equivalent, Associates Degree, Bachelors Degree, Masters Degree, and Doctorate Degree. Experience was a standard measure of age-years educated-6. Including a squared experience feature allowed the model to also account for non-linear income returns on experience (meaning experience typically increases your income more at the beginning of a career than additional years do once a worker is older). The State controls consisted of 56 dummy variables to account for variation between all the U.S. states and territories. Dummy variables or whether the individual lived in an urban or rural area are based off of U.S. Census’ Public Use Microdata Area Codes (PUMA’s). This code indicates areas of 100,000 populations or more, and is unique within each state. Work Status indicates whether the individual is Part Time (less than 30 hours a week) or Full Time (35 hours or more a week).
Three versions of the above model were tested, each time changing the independent variable of “Partner Status” to reflect a different group – gay partners overall, male-male partners, and female-female. I also incrementally added control variables of interest so that specific effects could be better observed. Results for each of the models are below!

The summary statistics from before showed that on average same-sex partnered individuals earn more than the average U.S. population as well as people who identified themselves as an opposite-sex unmarried partner couple. However, it also showed that gay individuals in this group also had higher average education levels, less average number of children, and a higher percentage working full time. For these reasons I can certainly see why the income levels would be higher on average, but column 6 of the results table shows that even after controlling for all these things gay individuals who are living with a partner still make $182.85 a month more on average! The table shows the change of the target coefficient as different controls are incrementally added to the model. The move from columns 3 to 4 and from 5 to 6 are exceptionally large, meaning that the fact that gay individuals tend to live in more metropolitan areas and work in certain occupations account for a lot of the initial positive income gap for gay individuals.


So, overall, results were similar to what had been found previously:
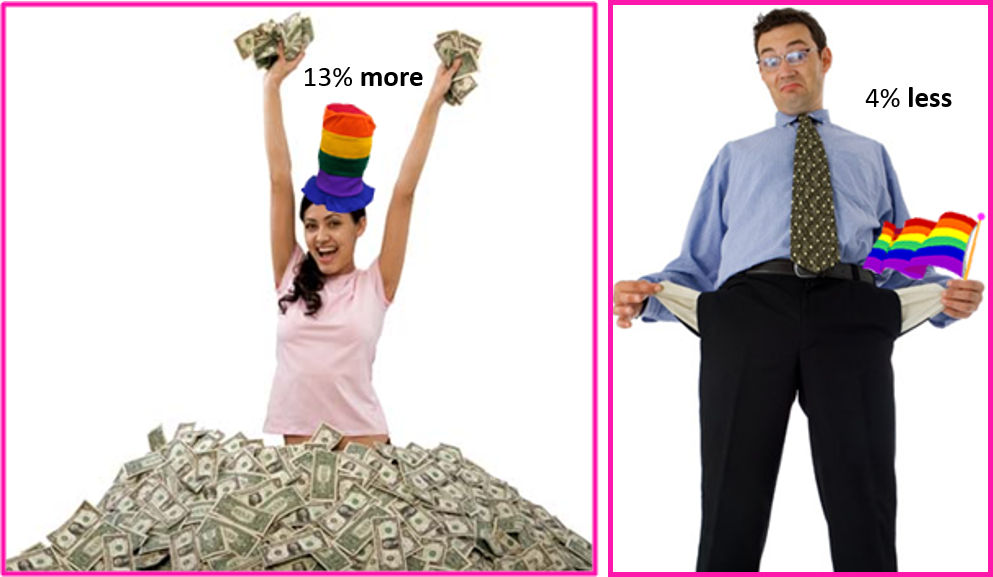
The goal of this analysis was to explore possible reasons responsible for income disparities between individuals in same-sex relationships and those in opposite-sex relationships. The set of controls that I added did account for a large portion of the difference, but even after accounting for everything I could think of, the effect did not disappear. More interesting, and like what has been found before, is that the effect for gay women and men is opposite. Similar studies in other fields have typically claimed this portion to be discrimination. This likely a factor, but the opposite effect for males and females suggests that the issue is more complicated.
Ahmed and Hammarstedt (2010) explain the opposite effect happens because gay men face increased hostility by straight men, who are over-represented in upper level management positions. This is certainly an interesting argument that is anecdotally convincing to me. I would further argue though that this specific type of discrimination has more to do with gender stereotypes, presentation, and the undervaluation of so-called “feminine” qualities some gay men are perceived to have rather than purely based on sexual orientation. The paper similarly discussed prevailing perceptions that lesbians are believed to be more “masculine”, independent, assertive, and self-confident than straight women. This whole concept of gendering characteristics both amuses and angers me, but for me there is no doubt that it is a factor here.
Carpenter (2008) offers a life choices explanation. He argues that lesbians choose to invest in more marketable skills because they anticipate being the primary source of income for a future family, whereas their straight counterparts might not. Much of this should be accounted for in the education and occupational controls, but, what the model would not pick up on are more squishy factors such as work ethic or attitude. Both working gay men and women might be breadwinners for their families, but gay women might be especially motivated if they are also a gender minority in their industry or position.
Another thing to consider is that this sample only accounts for gay individuals in committed partnered relationships. To employers, this might be a signal that they are settled down and stable, and likely without the distractions of kids and a family. These might be very attractive characteristics to a manager looking to hire or promote an employee. This could be especially true for women. Other studies in the gender disparity field have asserted that part of the negative income gap for women is attributed to employers discriminating against young female employees because they are more likely to leave unexpectedly to start a family. This effect could potentially be opposite for lesbians, meaning that employers see them as more stable employees, less likely to quit suddenly due to pregnancy or marriage.
Another explanation could have to do with sexual orientation STILL not being a protected Equal Opportunity Employment status in all states. This means that in many places it is legal not to hire someone just because they are or are suspected of being gay. Even when protected, violations are hard to prove. A gay candidate might be passed over for not “fitting the culture” or another subjective measure. Applied to my results, this means that gay individuals who are employed are most likely so in an accepting workplace to even get the job. More competition among gay people for jobs in companies that are known for a tolerant environment would mean working gay employees are possibly of higher quality, and would earn more money because of it. However, because gay men are over-represented in sales occupations, more of their income is likely to be based off commission. Customer as opposed to employer discrimination could negatively affect their paycheck.
These are just some explanations of what could be happening to explain the remainder of the income difference between gay and straight individuals. Discrimination, interacting with gender issues and manifesting in different ways for gay men and women, as well as life choice and environmental factors are all possible reasons. All that can really be concluded is that these groups have some characteristic or combination of qualities about them, other than those that are controlled for in the model, which makes lesbians more financially successful in the labor market and gay men less so than their straight counterparts. Further study and investigation into this complicated issue should be explored.
Q2: Do different state marriage laws affect the income levels of gays living in those states?
After looking at the overall wage difference for gay partnered individuals, I wanted to test if there was an additional income differences for gay individuals depending on their states’ marriage policy. I summarized above how the marriage equality laws between states at the time were pretty much a hot mess. While it seems like it would make more sense to focus on employment laws, gay marriage was the controversial hot topic of the day and getting the most attention. I wanted to test if the states that had some sort of pro-gay marriage law translated into more income for its gay residents. I figured that if a state had such a policy, it would be more likely to have citizens and employers that are more accepting of a gay lifestyle. In addition, gay individuals who have the means might seek to move to such states for the increased acceptance. In contrast, states that went out of their way to explicitly ban such unions might undervalue gay employees and/or drive them out of the state.
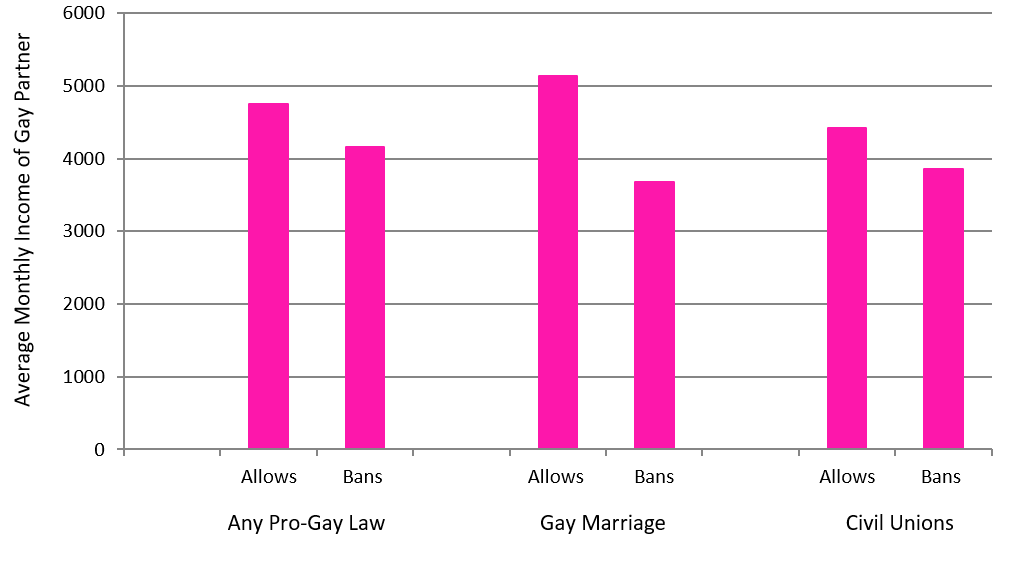
At first glance, the data showed some promise for my theory. In general there was an overall difference in gay partner’s income between states with different marriage policies. On average, gay individuals that lived in states that had some sort of marriage equality law in place made more than those that ban gay unions. The biggest gap was between states that allow and ban gay marriage specifically. Even though this wasn’t the most extreme of the laws, it made sense that it showed a greater effect. Gay marriage was by far the most controversial of the policies, and if I was wanting to use the presence of these laws as a proxy in my model for acceptance by citizens and employers within the state, it would make sense that the most debated laws might be the most influential to the citizens. Keep in mind that almost all of these laws had come into effect through the courts, and not popular vote. This means that the laws themselves are not a direct result of already increased or decreased acceptance by citizens.
Differences in Gay Partner Income, by State Marriage Policy
Like before, exploratory findings don’t really prove anything since the differences could be due a number of reasons other than the legal environment. To statistically test this theory then, I limited my dataset to ONLY the gay partners. I then modeled their monthly income as a function of their state law status as well as all control variables that we saw before. Like so:

In this model partner status was an additional control since all of the observations are those who reported living with an unmarried same-sex partner. This controlled for variation between male-male and female-female partner incomes that wasn’t already accounted for in the sex control. Also average state income is controlled for to account for the fact that most of the pro-gay states were high income east coast states, while many of the ban states were southern states with lower average incomes.
I ran 8 different versions of this model, changing out the independent variable to look at states with different laws regarding gay marriage. States with pro-gay laws were categorized as those that allow gay marriage, allow civil unions, recognize gay marriages performed in other states, and an all-encompassing variable called “gaystate” for those states that had any one of these laws in place. I also looked at states that had different sorts of marriage bans to see if income would be less for gay partnered individuals in these states, due to less acceptance by my theory. Amendments that had been passed in these states were broken down into bans on gay marriages only, bans on gay marriages and civil unions, bans on these and any other “marriage-like” contract between gay individuals, and another overall variable that looks at states with any of these laws. Note that these are states that had taken measures to change the state constitution and explicitly ban these ceremonies. A lack of a ban did not mean that it is allowed. Results testing the causality are below!

According to my hypothesis, I was expecting to find a positive effect in states that have pro-gay laws like allowing gay marriage. I claimed that increased acceptance in these states would translate into more income for gay individuals living there. The model results disprove this though, and showed no significant income differences for gay individuals that live in these states compared to others.

So, the results didn’t quite fit with my original hypothesis, but after considering what the data was showing, they started to make sense. I considered the notion of acceptance; Being accepted doesn’t mean that you are treated more favorably, it just means that you are treated the same. This is consistent with the insignificant model findings for pro-gay states. On the other hand, the negative income effect for gay partnered individuals in states with a ban on gay marriage did suggest that decreased acceptance translated into lower incomes for gay partnered individuals. This suggested a degree of discrimination, but like in the first analysis, it was unlikely to be the whole story. State of residence is (in theory) a choice. If a gay individual and their partner choose to live in a state that is less accepting of their lifestyle it is most likely because of family ties and/or financial inability to move to a more accepting location. These factors, or potential income-affecting personality traits that could be inferred from these factors, would not be accounted for in the model.
Other explanations could include the role of media and the environment’s impact on the overall “outness” of the individual. States with different political leanings most definitely had different press coverage and reports of the gay marriage debate. States that allowed gay marriage most likely had more positive news coverage of the issues which could influence the opinions of citizens and employers in that region. Also gay people in these states might’ve felt more comfortable being “out” to their friends and families, increasing awareness to the general population about gay lifestyles. Oppositely, states that had taken measures to ban gay marriage might have had news coverage that portrayed gay marriage and relationships as negative and threatening. Gays living in these states would have more reasons to stay “in the closet”, contributing further to citizen’s lack of understanding and intolerance. In addition, without or with a limited coming out experience, gay individuals in these states might have not shared the income boosting characteristics that other gays that had gone through this process either already possessed or acquired.
Like the previous analysis, the data and model results shed some light on the issue, but brought to light many unknowns and additional things to consider. With marriage equality now nationwide, the policy implications of this analysis are no longer very relevant. However, the political climate between states is somewhat similar as it was then, I would be interested to revisit this analysis to see if anything has changed.
I tried to make it very clear that these findings are only representative of gay individuals that reported themselves as living with a partner, and shouldn’t be generalized to the entire gay population without further analysis. Partnered gay individuals, like any person in a committed relationship have a very unique set of characteristics, so trying to make conclusions about all gay people based on only this subset would not be good practice. If data allows in the future, it would be interesting to examine these issues applied to the broader community.
Looking back on this analysis now I see so much room for improvement – from the scoping, to the feature extraction and modeling, to (definitely) the visualization. Which is kind of neat to see how much I’ve grown over the years with experience. However, the takeaway now is still the same as I came to back then, and the overall mission of this website:
We need better data on the LGBTQIA+ community. We need accessible data driven research and analysis to bring these issues to light in an unbiased and empirical manner. Better understanding rooted in objective findings as opposed to subjective beliefs and opinions will result in more inclusive policies and environments, improving the quality of life for everyone.