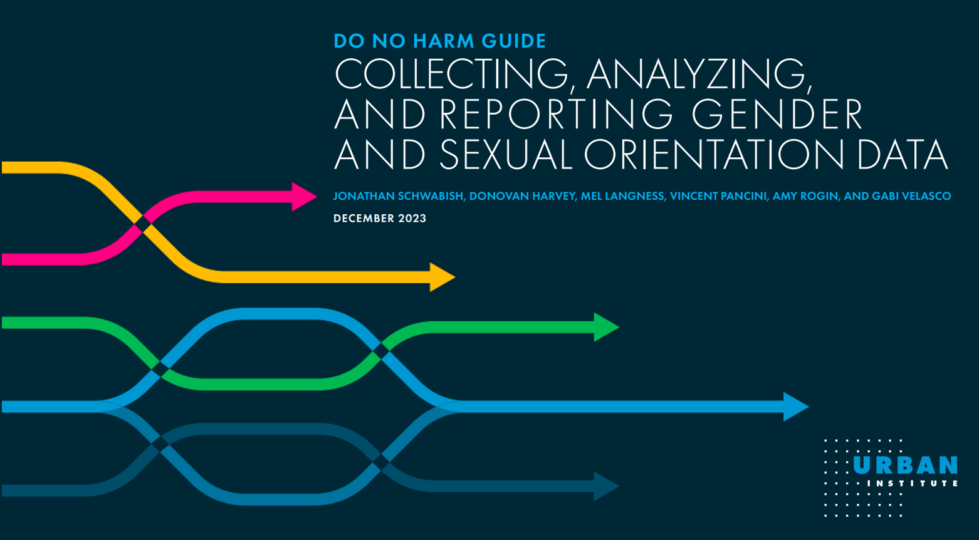
Gayta Science’s own Kelsey Campbell was recently on the Advisory Board for Urban Institute’s fifth installment of the Do No Harm Project, exploring the current state of data around sexual orientation and gender identity (SOGI).
Below you'll find a list of all posts that have been tagged as “data”
Gayta Science’s own Kelsey Campbell was recently on the Advisory Board for Urban Institute’s fifth installment of the Do No Harm Project, exploring the current state of data around sexual orientation and gender identity (SOGI).
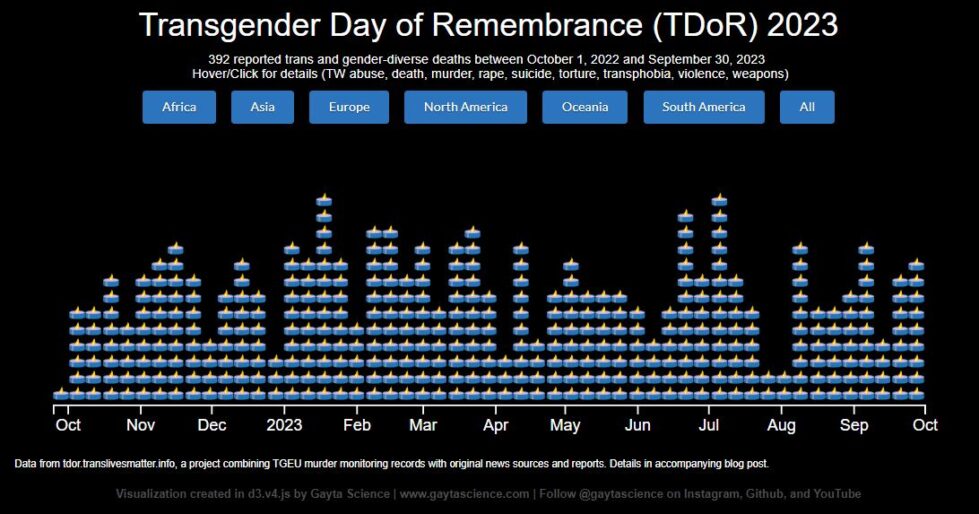
Transgender Day of Remembrance (TDoR) is observed every year on November 20th to honor and memorialize those who have been lost as a result of transphobia. It also calls attention to the continued violence endured by the transgender and gender-diverse communities. I sought to create a visually appealing, interactive data visualization that spoke to both of these goals. Final Visualizations: …
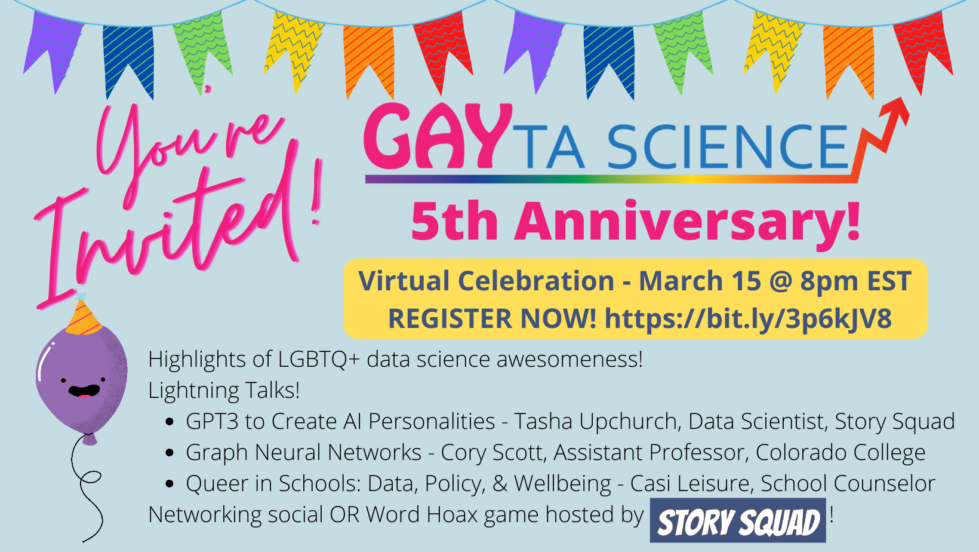
WOW! Time sure does fly! Gayta Science celebrated our 5th ANNIVERSARY this month! The site was officially purchased on March 4th, 2017 and has been producing awesome LGBTQ+ data science ever since! To celebrate this significant milestone, we gathered for an epic virtual celebration party! It was an incredible night! Kelsey started us off with a whirlwind tour of 5 years …
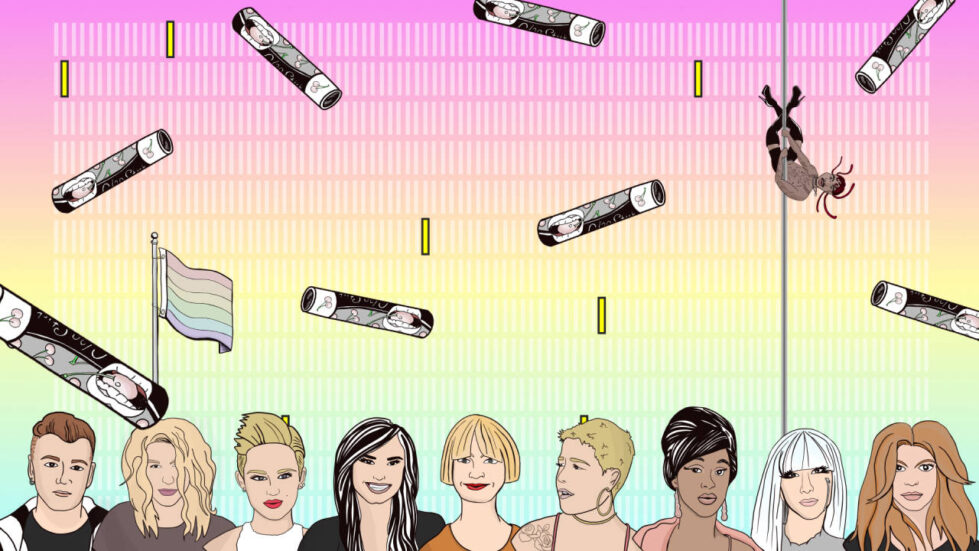
The Pudding is an AWESOME digital publication that puts out stunning visual essays and data visualizations about a variety of culturally relevant topics. Gayta Science’s own Kelsey Campbell recently got the chance to help the incredibly talented Jan Diehm tell a story about queer song lyric representation! As a super fan for years, contributing to this project was an honor and an …
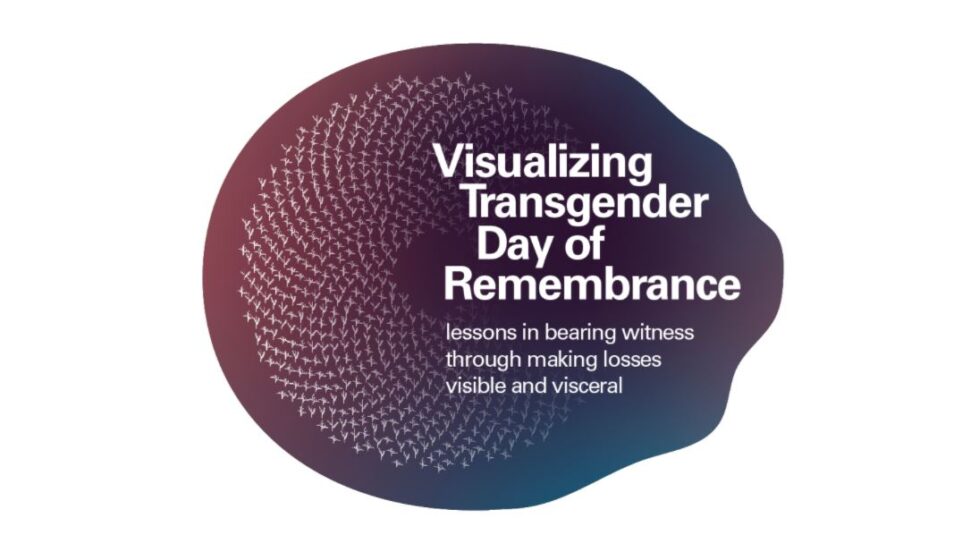
Gayta Science’s Cathryn Ploehn and Kelsey Campbell were part of a rockstar lineup of data practitioners and designers at the Data Visualization Society’s first-ever Outlier Conference! While the conference as a whole was a high-energy three days of inspiring visualization talks and networking, Gayta Science brought a serious and thought-provoking talk about our experience visualizing anti-trans violence. Visualizing Transgender Lives …
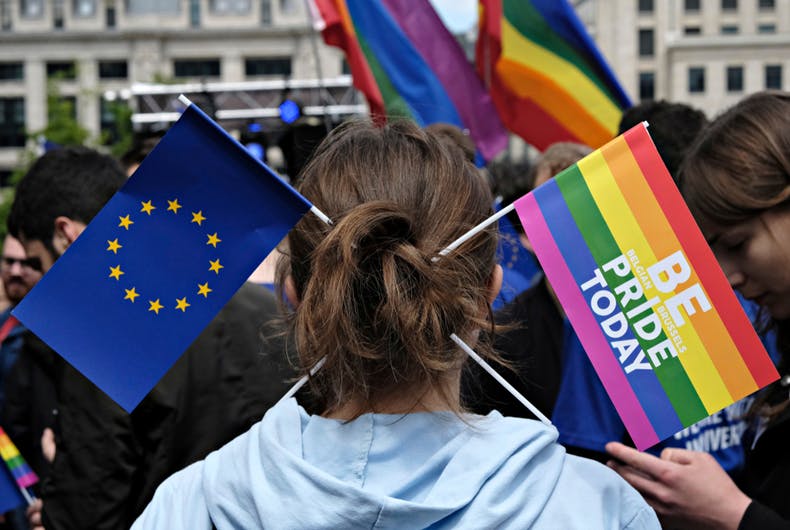
In 2012, the European Union Agency for Fundamental Rights (FRA) conducted a survey among lesbian, gay, bisexual and transgender (LGBT) people living in the 28 European Union (EU) countries (including Croatia). The aim of the survey was to obtain robust and comparable data that would allow a better understanding of LGBT people experience the enjoyment of fundamental rights. Around 93,000 …
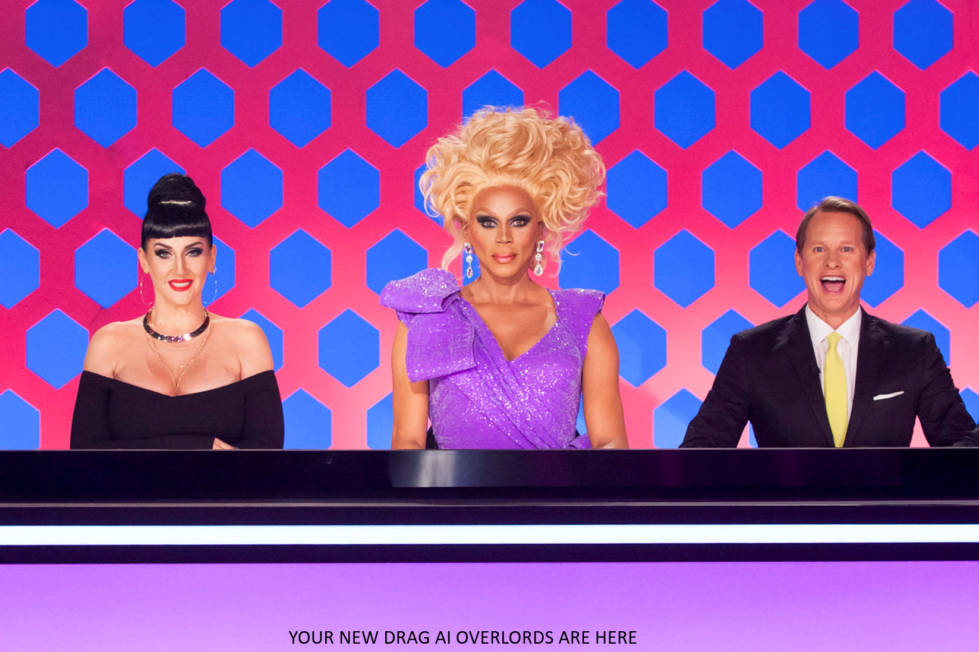
This is the BeginningRupaul’s Drag Race is my favorite show of all time and as a data analyst it’s always been my dream to use data about the show and queens to make observations about the shows contestants and predictions on their performance and castings. I knew that this had to start with the data, making it clean and accessible is the …
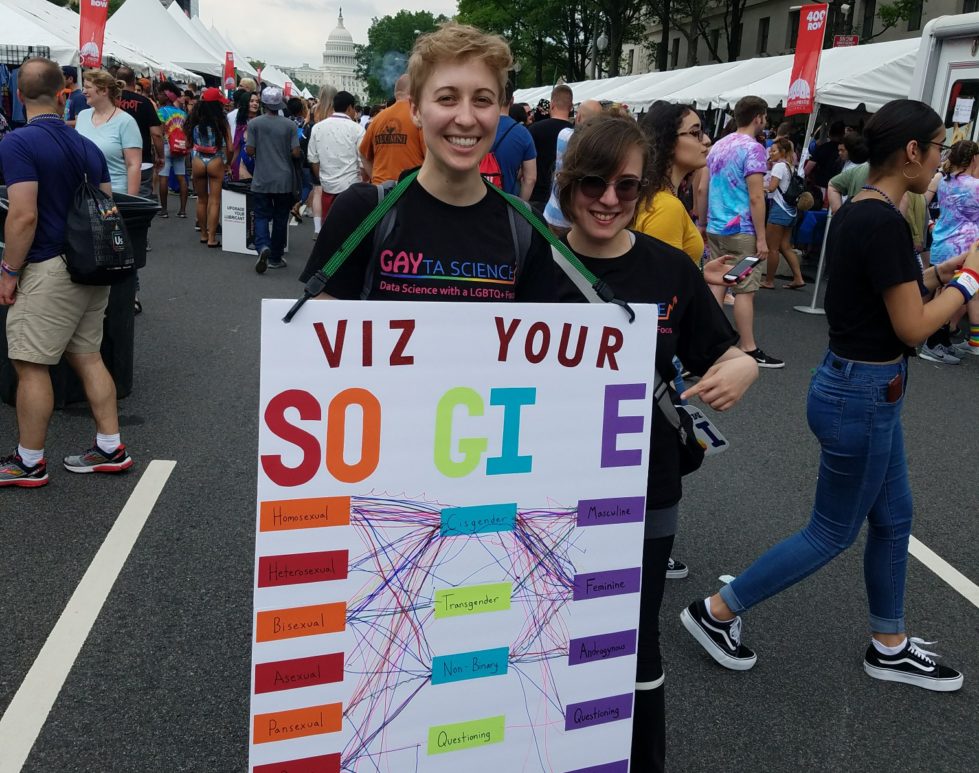
A couple of us on the Gayta Science team decided to take the show on the road this past weekend! We hit DC Pride with the goal to create a collective data visualization of people’s SOGIE’s! SOGIE is an acronym that stands for Sexual Orientation, Gender Identity, and Expression. Which means that EVERYONE has one, whether they are gay/straight/trans/cis/in-between/whatever! We …
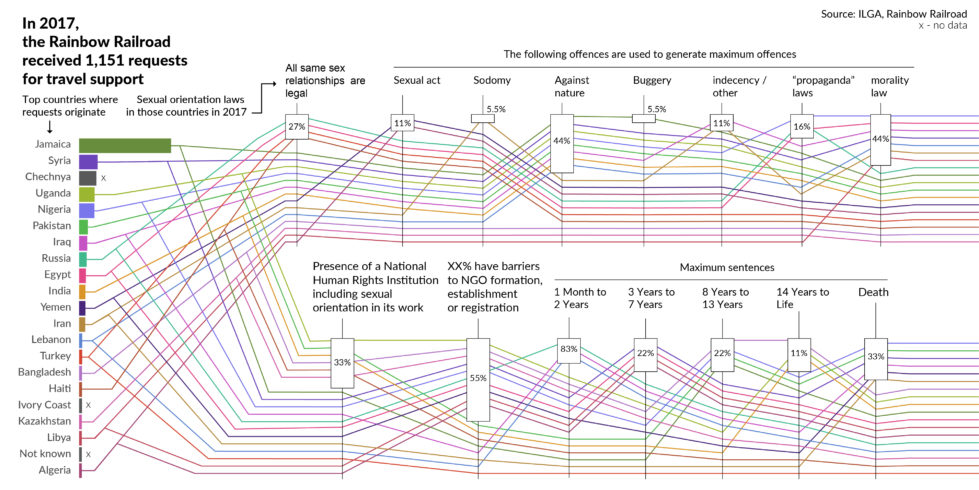
LGBTQ+ people around the world face state sponsored violence, ranging from laws against promotion of LGBTQ+ identities to laws prohibiting non-heterosexual relationships. To take stock of the specific laws people must face in different countries, the International Lesbian, Gay, Bisexual, Trans and Intersex Association publishes a world survey of sexual orientation laws, the State-Sponsored Homophobia report. Endangered by these types of laws (and other factors), …

Every month for 2018 the reddit /r/dataisbeautiful is hosting a data visualization challenge! Each challenge features a new dataset that users get the chance to be creative with, all for a chance to earn “Reddit Gold”. To my delight, February’s challenge was all about same-sex marriage in the US! A dataset originally from Pew Research Center contained the legal status of all …