Gayta Science’s own Kelsey Campbell was recently on the Advisory Board for Urban Institute’s fifth installment of the Do No Harm Project, exploring the current state of data around sexual orientation and gender identity (SOGI).
Below you'll find a list of all posts that have been tagged as “visualization”
Gayta Science’s own Kelsey Campbell was recently on the Advisory Board for Urban Institute’s fifth installment of the Do No Harm Project, exploring the current state of data around sexual orientation and gender identity (SOGI).
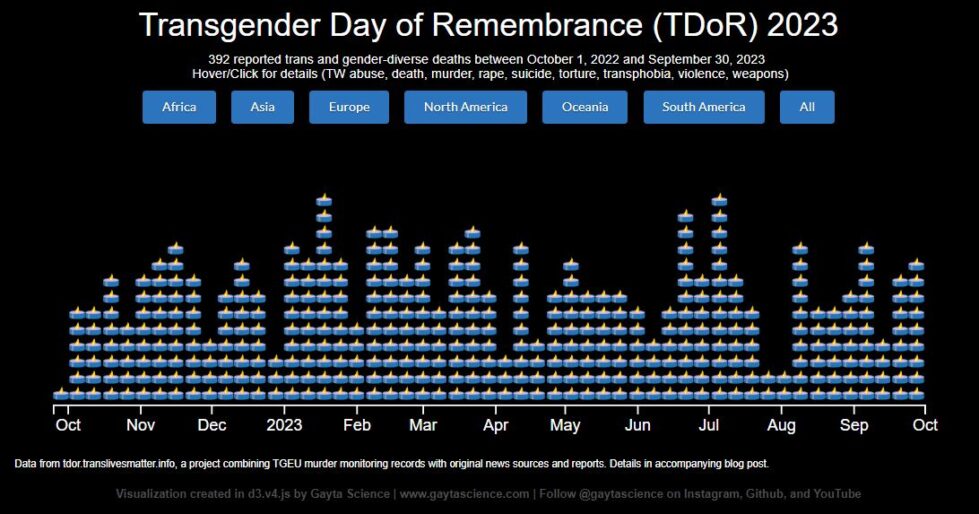
Transgender Day of Remembrance (TDoR) is observed every year on November 20th to honor and memorialize those who have been lost as a result of transphobia. It also calls attention to the continued violence endured by the transgender and gender-diverse communities. I sought to create a visually appealing, interactive data visualization that spoke to both of these goals. Final Visualizations: …
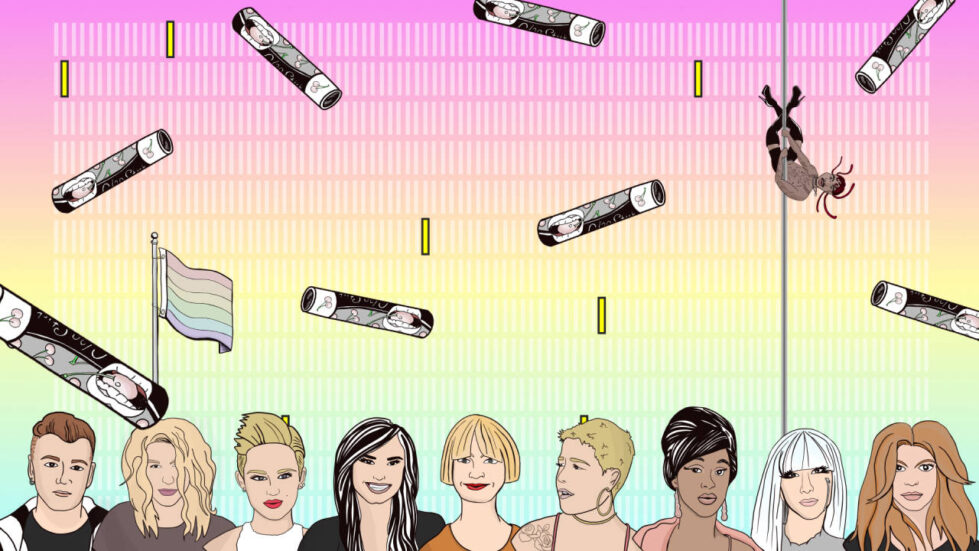
The Pudding is an AWESOME digital publication that puts out stunning visual essays and data visualizations about a variety of culturally relevant topics. Gayta Science’s own Kelsey Campbell recently got the chance to help the incredibly talented Jan Diehm tell a story about queer song lyric representation! As a super fan for years, contributing to this project was an honor and an …
Gayta Science’s Cathryn Ploehn and Kelsey Campbell were part of a rockstar lineup of data practitioners and designers at the Data Visualization Society’s first-ever Outlier Conference! While the conference as a whole was a high-energy three days of inspiring visualization talks and networking, Gayta Science brought a serious and thought-provoking talk about our experience visualizing anti-trans violence. Visualizing Transgender Lives …
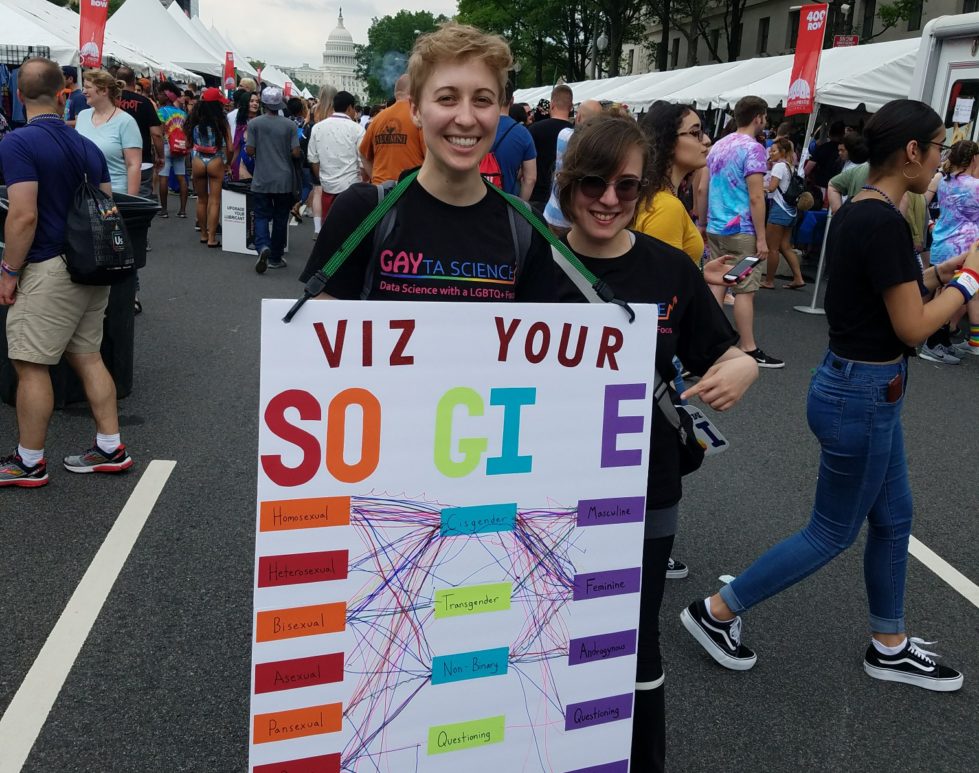
A couple of us on the Gayta Science team decided to take the show on the road this past weekend! We hit DC Pride with the goal to create a collective data visualization of people’s SOGIE’s! SOGIE is an acronym that stands for Sexual Orientation, Gender Identity, and Expression. Which means that EVERYONE has one, whether they are gay/straight/trans/cis/in-between/whatever! We …
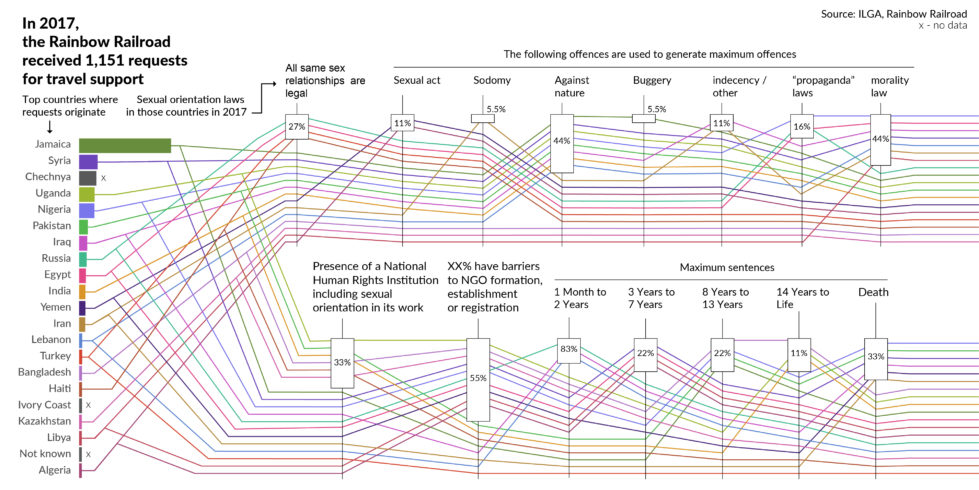
LGBTQ+ people around the world face state sponsored violence, ranging from laws against promotion of LGBTQ+ identities to laws prohibiting non-heterosexual relationships. To take stock of the specific laws people must face in different countries, the International Lesbian, Gay, Bisexual, Trans and Intersex Association publishes a world survey of sexual orientation laws, the State-Sponsored Homophobia report. Endangered by these types of laws (and other factors), …

Every month for 2018 the reddit /r/dataisbeautiful is hosting a data visualization challenge! Each challenge features a new dataset that users get the chance to be creative with, all for a chance to earn “Reddit Gold”. To my delight, February’s challenge was all about same-sex marriage in the US! A dataset originally from Pew Research Center contained the legal status of all …
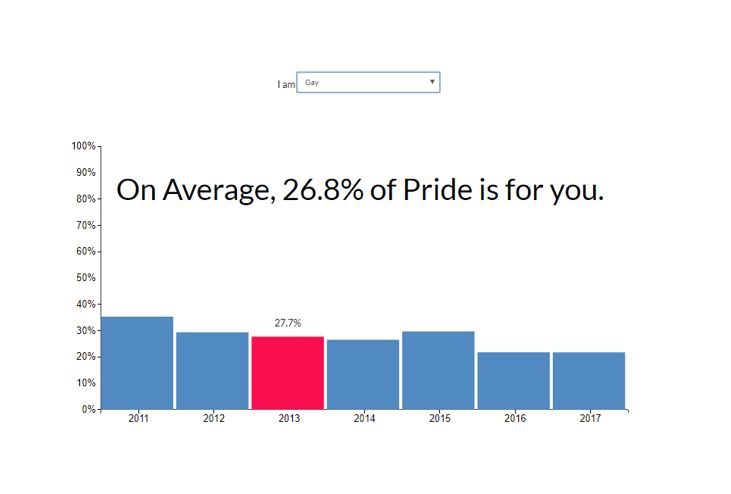
The LGBTQ+ community is very diverse – in terms of race, ethnicity, ability, class, religion, you name it. It also includes a wide variety of things – sexual orientations, sexualities, sexes, gender identities, relationship arrangements, and more. As inclusive as the community is in theory, how much of this is actually reflected in Pride celebrations? Like previous posts have explained, …
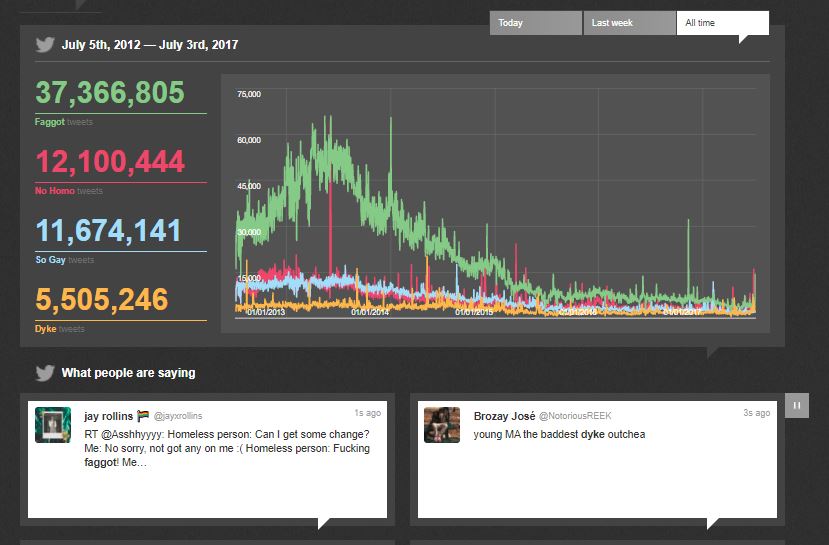
Another awesome gay data viz that deserves a shoutout! NoHomophobes is a project out of University of Alberta’s Institute for Sexual Minority Studies and Services that has been tracking homophobic language on Twitter for years now! The interface features a real-time counter for 4 homophobic terms, a scrolling ticker for the actual tweets (some are really hateful, be careful), and …
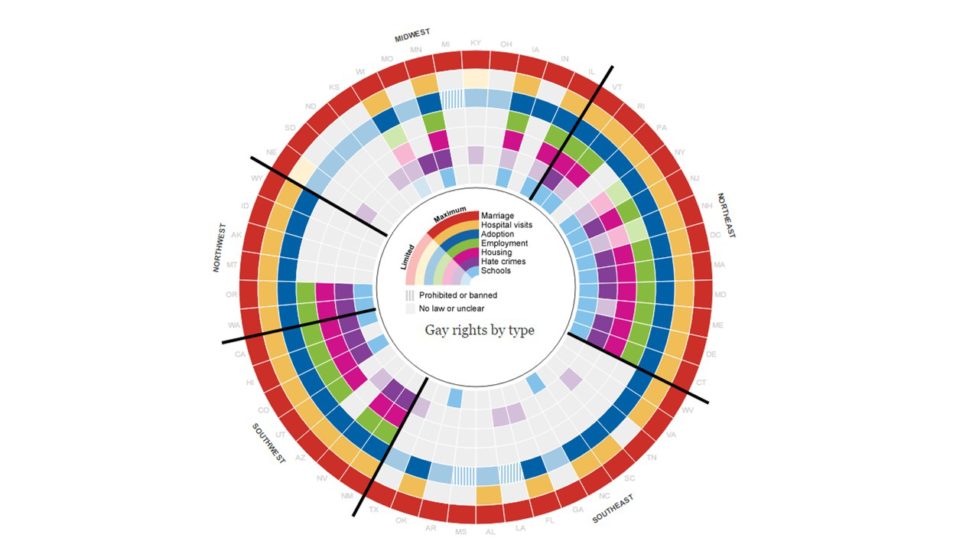
Aka the visualization that shaped my career. So The Guardian has this page that tracks gay rights in the US by state. It is a 100% awesome. Colored chunks for different kinds of rights, states are grouped so regional patterns are apparent, interactive hovers bring up additional information about the state’s legal environment. Hours of fun people! Awesome interactive visualizations …