Gayta Science’s own Kelsey Campbell was recently on the Advisory Board for Urban Institute’s fifth installment of the Do No Harm Project, exploring the current state of data around sexual orientation and gender identity (SOGI).
Below you'll find a list of all posts that have been tagged as “transgender”
Gayta Science’s own Kelsey Campbell was recently on the Advisory Board for Urban Institute’s fifth installment of the Do No Harm Project, exploring the current state of data around sexual orientation and gender identity (SOGI).
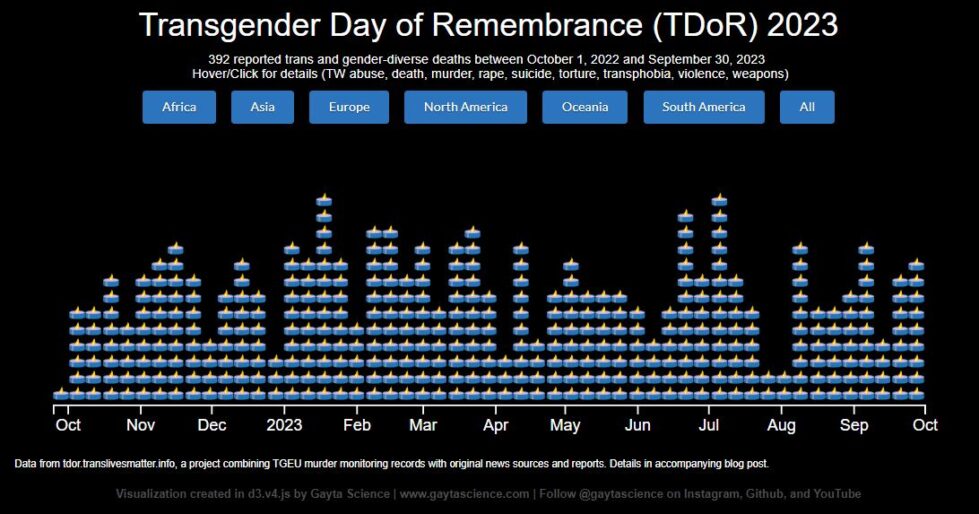
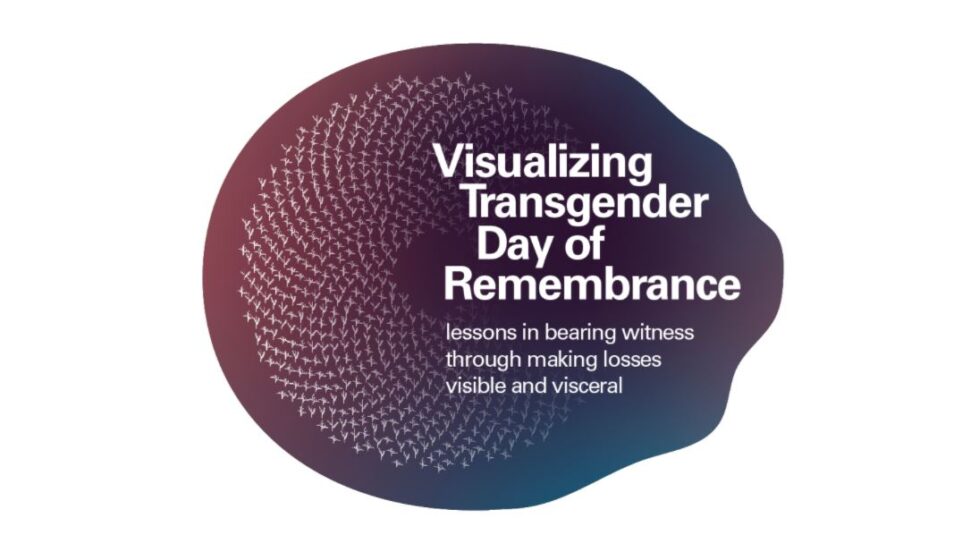
Transgender Day of Remembrance (TDoR) is observed every year on November 20th to honor and memorialize those who have been lost as a result of transphobia. It also calls attention to the continued violence endured by the transgender and gender-diverse communities. I sought to create a visually appealing, interactive data visualization that spoke to both of these goals. Final Visualizations: …
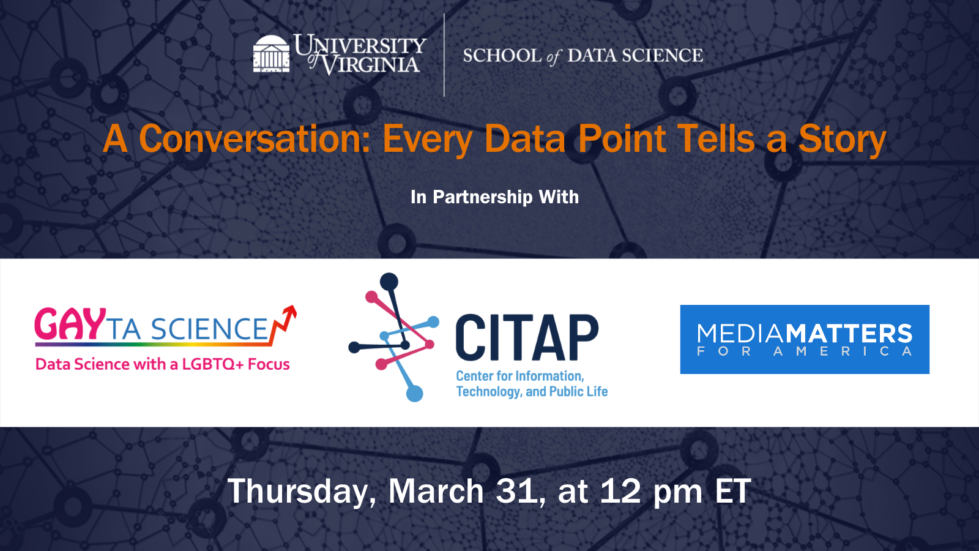
This Transgender Day of Visibility (TDoV), we joined an incredible panel put on by the University of Virginia School of Data Science to have an important conversation about social media algorithms, mis/disinformation, and the LGBTQ+ community. During the event, panelists covered the complexities of how transphobia, homophobia, racism, misogyny, and other discriminatory and extreme beliefs can rapidly spread on social platforms. …
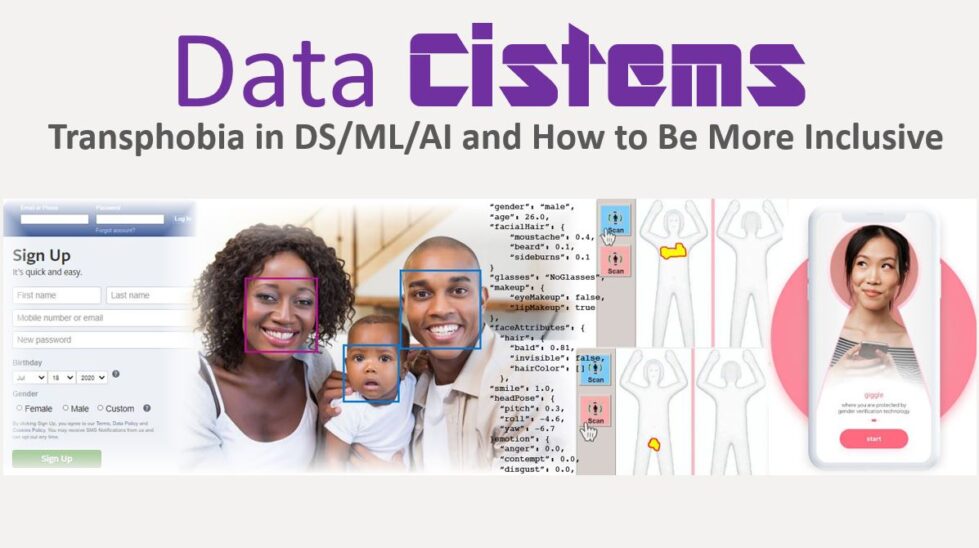
Curious about how transphobia finds its way into the algorithms that we encounter everyday? We got you covered! Kelsey Campbell gave a talk at the 2021 Responsible Machine Learning conference, introducing gender diversity, cissexism in automated systems, and leading research in the field! Check out the recording online and learn why we should, and how we can, do better to capture the complexity of gender in …
Gayta Science’s Cathryn Ploehn and Kelsey Campbell were part of a rockstar lineup of data practitioners and designers at the Data Visualization Society’s first-ever Outlier Conference! While the conference as a whole was a high-energy three days of inspiring visualization talks and networking, Gayta Science brought a serious and thought-provoking talk about our experience visualizing anti-trans violence. Visualizing Transgender Lives …
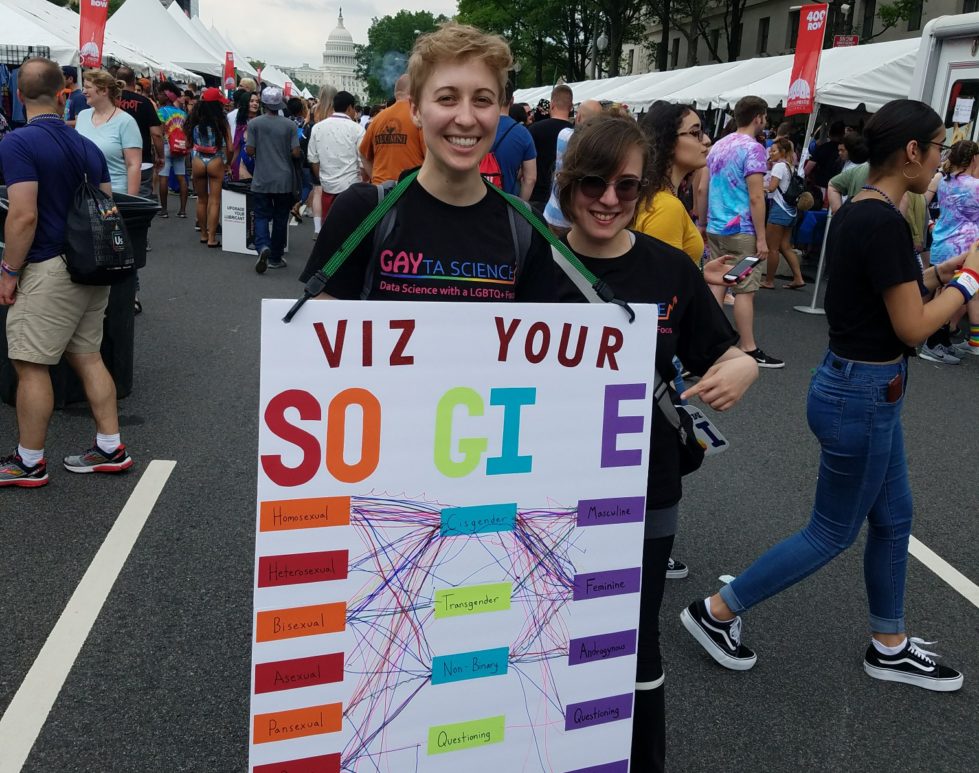
A couple of us on the Gayta Science team decided to take the show on the road this past weekend! We hit DC Pride with the goal to create a collective data visualization of people’s SOGIE’s! SOGIE is an acronym that stands for Sexual Orientation, Gender Identity, and Expression. Which means that EVERYONE has one, whether they are gay/straight/trans/cis/in-between/whatever! We …
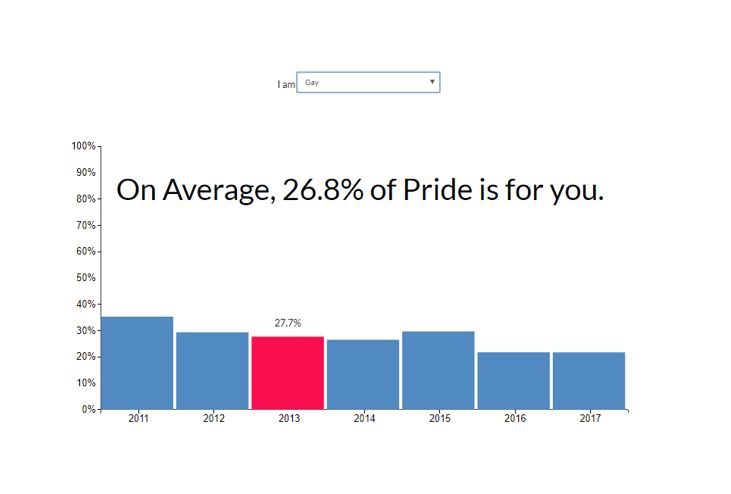
The LGBTQ+ community is very diverse – in terms of race, ethnicity, ability, class, religion, you name it. It also includes a wide variety of things – sexual orientations, sexualities, sexes, gender identities, relationship arrangements, and more. As inclusive as the community is in theory, how much of this is actually reflected in Pride celebrations? Like previous posts have explained, …