Histogram-like data visualization for Transgender Day of Remembrance 2023

TDoR: Honoring Transgender Victims with Data Visualization

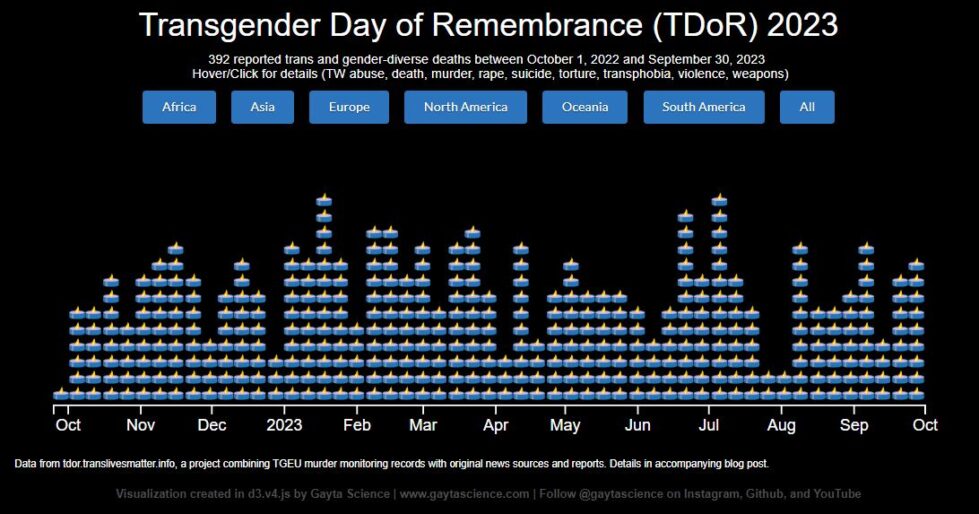
Transgender Day of Remembrance (TDoR) is observed every year on November 20th to honor and memorialize those who have been lost as a result of transphobia. It also calls attention to the continued violence endured by the transgender and gender-diverse communities. I sought to create a visually appealing, interactive data visualization that spoke to both of these goals. Final Visualizations: …

How much of Pride is for me?

The LGBTQ+ community is very diverse – in terms of race, ethnicity, ability, class, religion, you name it. It also includes a wide variety of things – sexual orientations, sexualities, sexes, gender identities, relationship arrangements, and more. As inclusive as the community is in theory, how much of this is actually reflected in Pride celebrations? Like previous posts have explained, …

Gay Rights, State by State

Aka the visualization that shaped my career. So The Guardian has this page that tracks gay rights in the US by state. It is a 100% awesome. Colored chunks for different kinds of rights, states are grouped so regional patterns are apparent, interactive hovers bring up additional information about the state’s legal environment. Hours of fun people! Awesome interactive visualizations …