So, I’ve had a long standing theory that Pride celebrations have gotten less fun over the years. It seems like every year I spend more and more time pity-clapping for a clearly uncomfortable and stuffy politician or dodging the growing army of HRC volunteers who “just need a minute of your time”. In an attempt to gauge whether this is based at all on reality or if I am just becoming a crotchety old queer, I turned to the data.
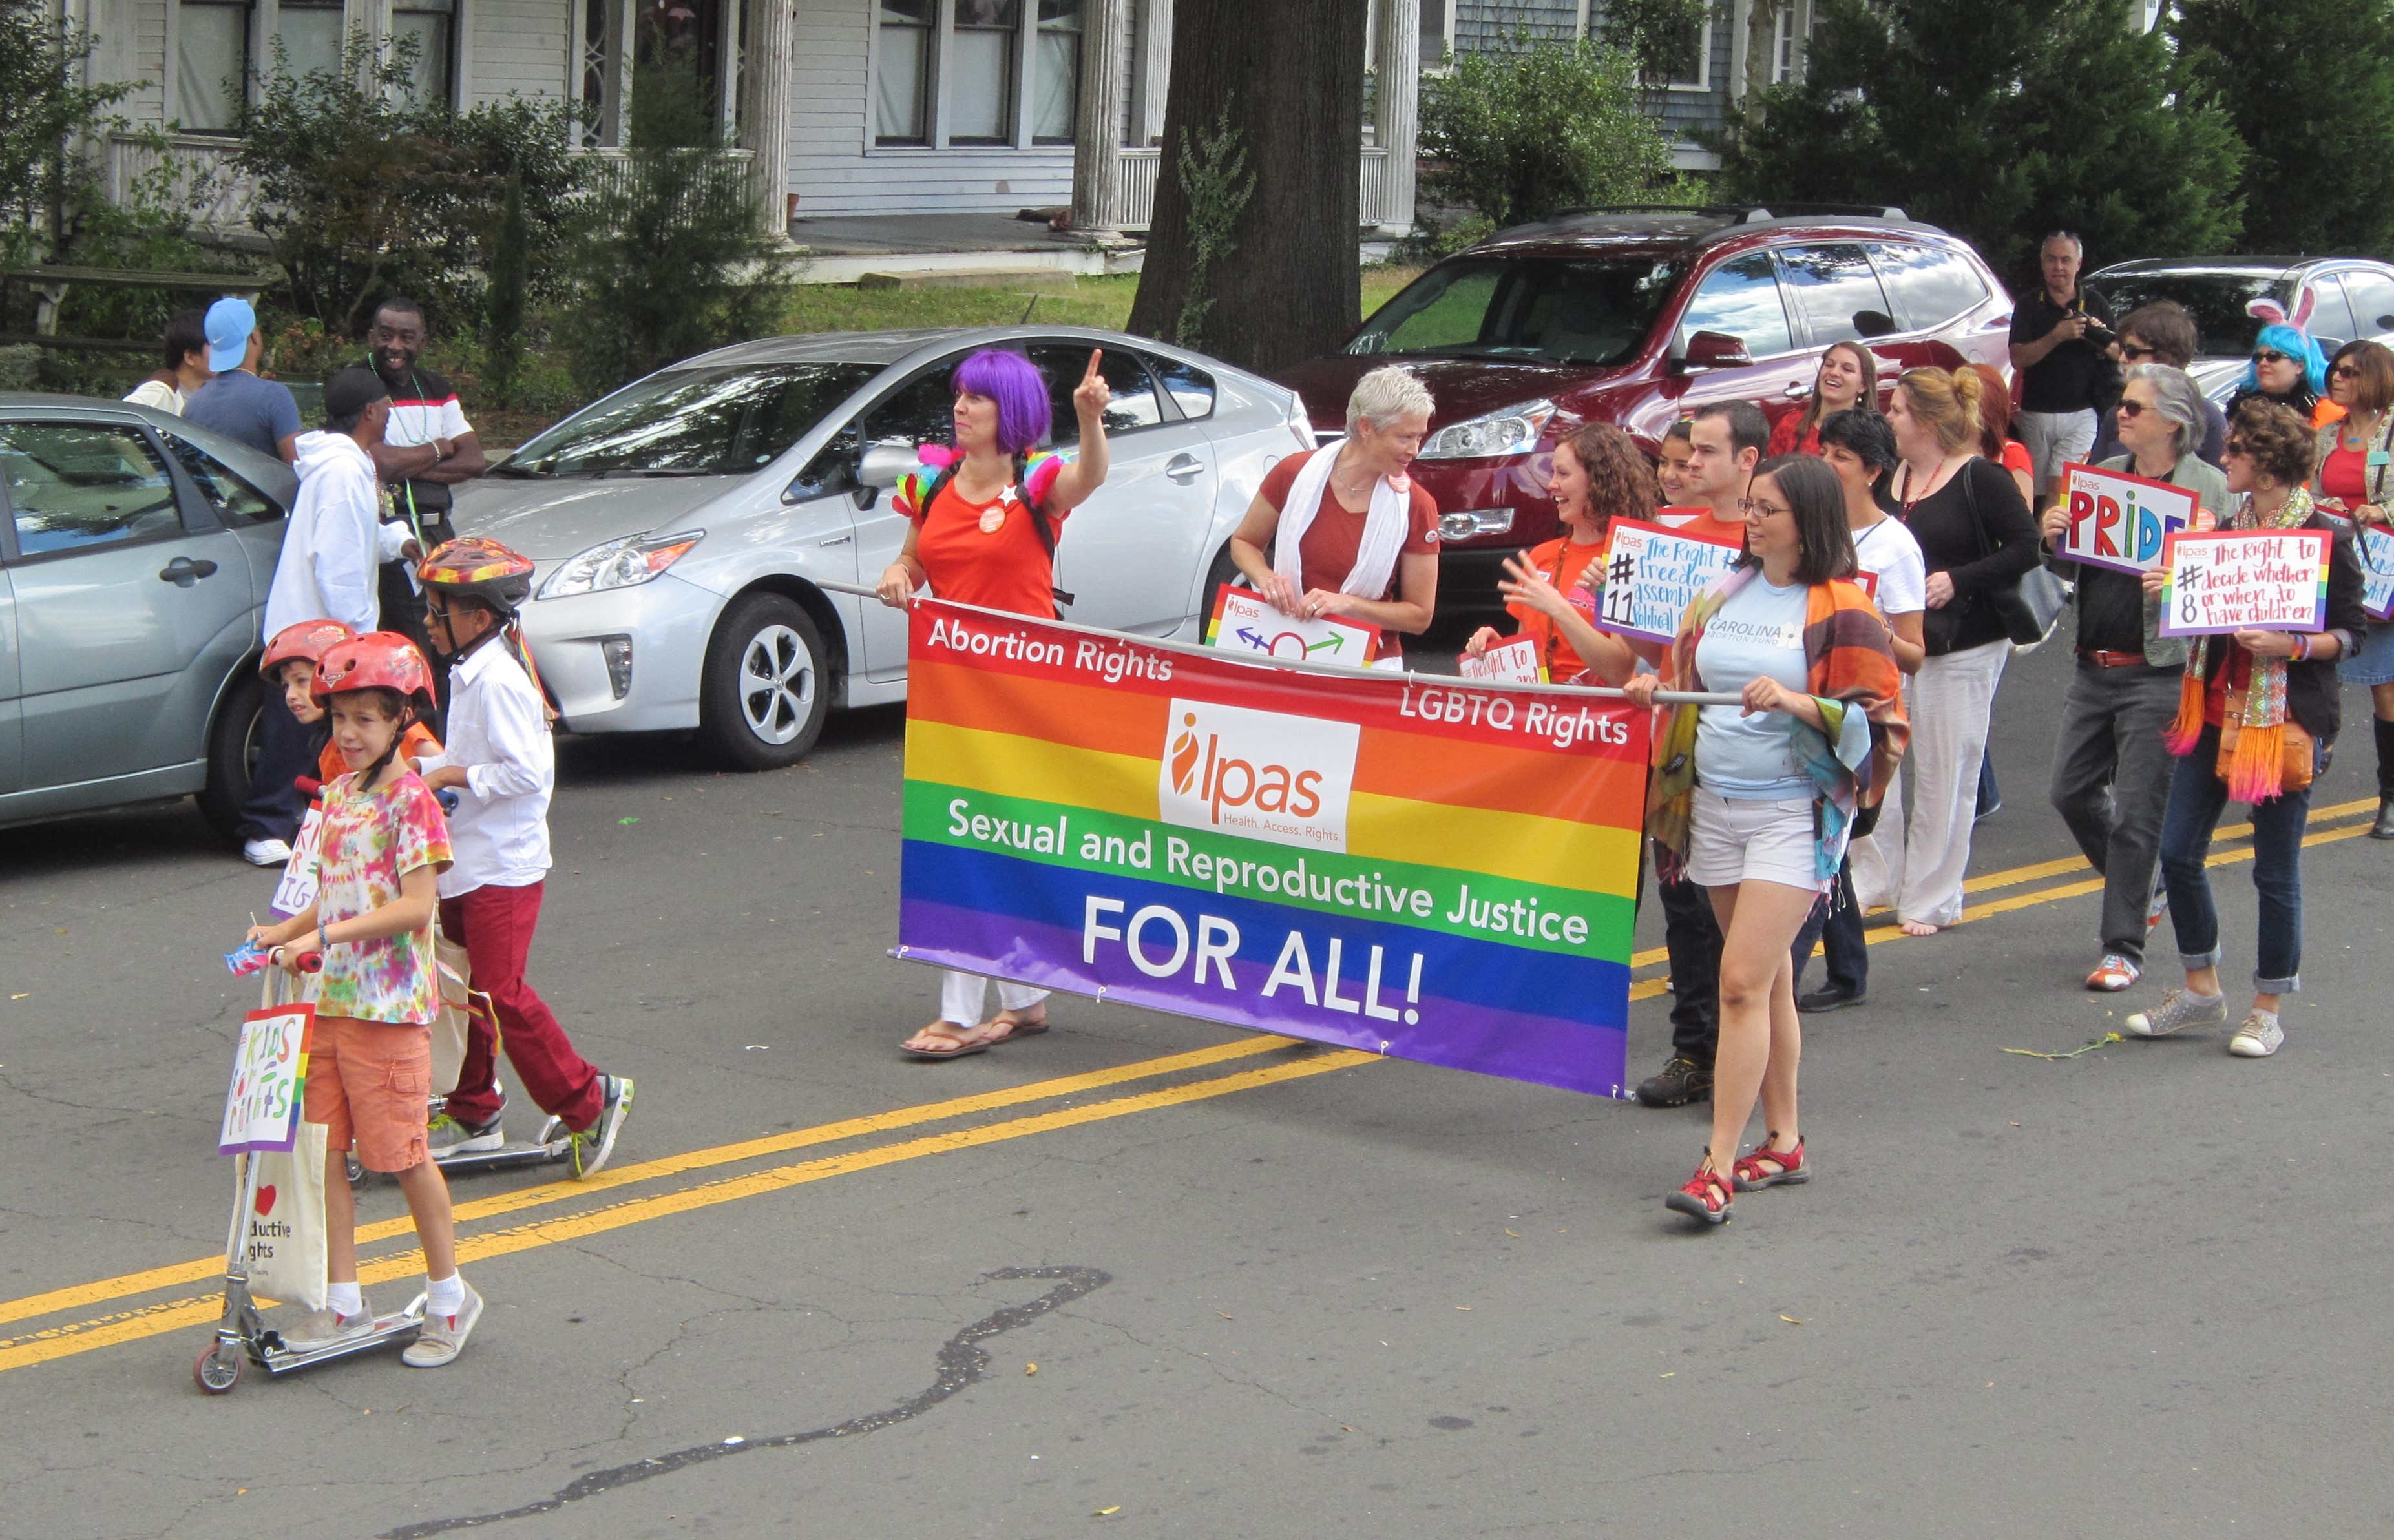
I was able to obtain parade line-ups from 2011 – 2017 for a large liberal city in the northeast. Pretty cool, huh!? There was not a huge amount of information, just the names of each entity, meeting spot, etc. I then went through and manually categorized the entities (Company, Community Organization, etc.) as well as gave them an official Gayta Science “Fun Score”. Full disclosure - I have never attended this Pride celebration so determinations were 100% reliant on internet research and my own generalizations about different types of parade entries and how much I’ve enjoyed them in the Prides I have attended. So very subjective of course, but, I think it’s a pretty universal thing that half-naked gay boys and drag queens dancing are way more fun than politicians in suits waving from donated cars or corporations trying to prove how gay friendly they are. Right?! There was some wiggle room depending on the specific entity (or ya know, my mood), but here are how things generally fared on the 10-point Gayta Science “Fun Score” scale:
10 | Nightclubs!!!
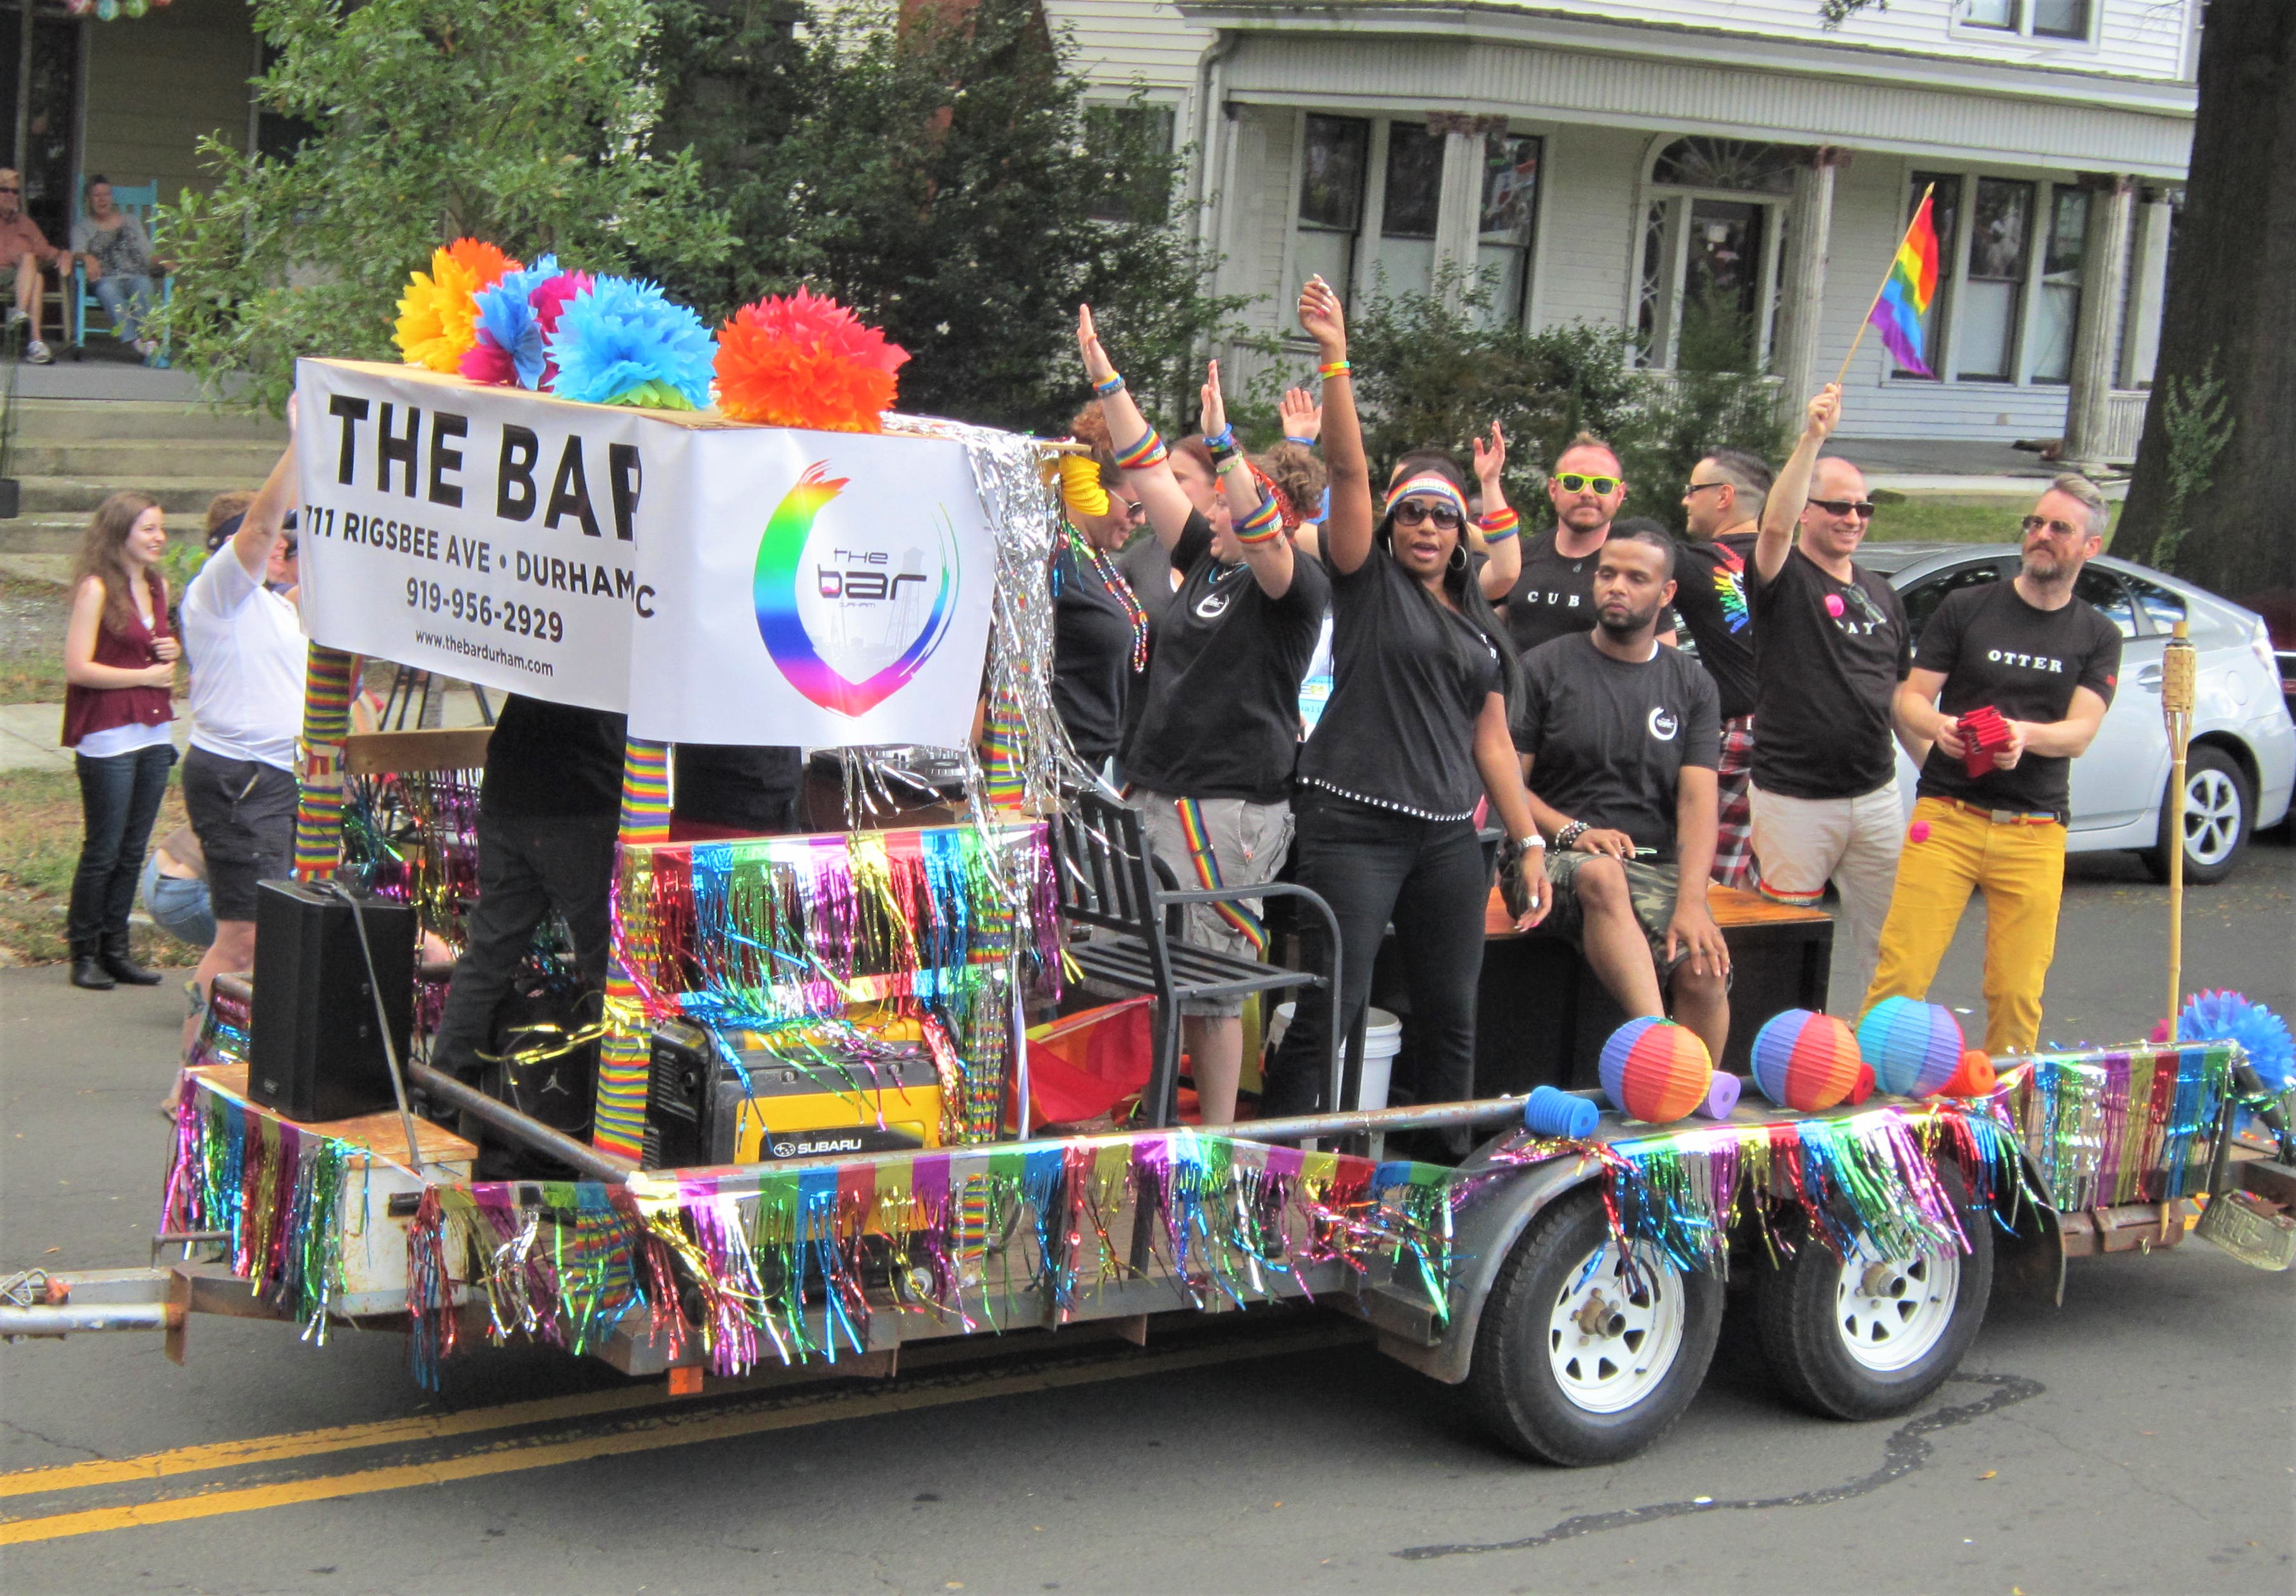
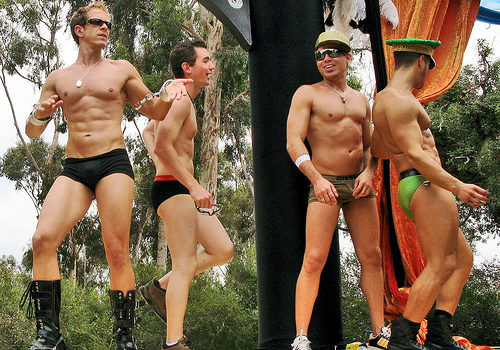
Gimme that blaring music with the dancers in the little shorts and body paint! The float can barely move cause there are so many bouncing people on it, every one of them decked out, expressing how they want, and having a great time being free. The energy is infectious and definitely Pride at its best.
9 | Animals!!!
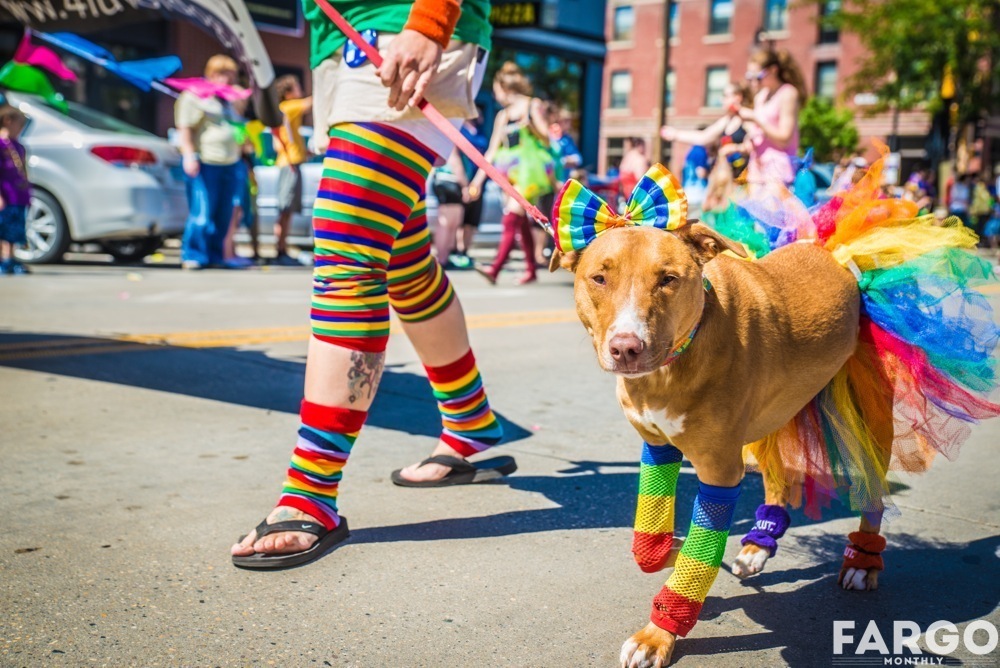
Prides usually have some sort of animal adoption presence (probably cause it’s hard to find a lesbian who won’t adopt another pitbull). It’s all good, who doesn’t like loving on all the shelter dogs!
8 | Entertainment!!!

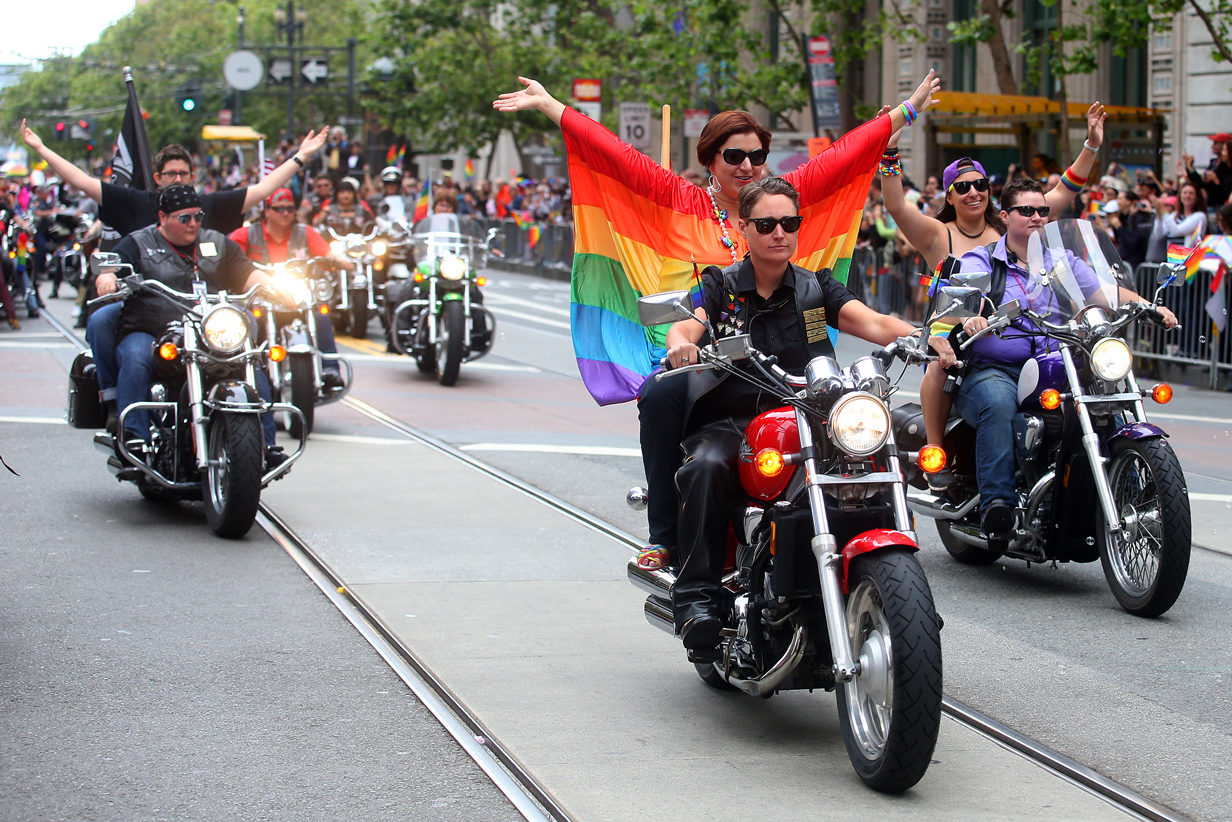
Here we have your marching bands, dancers, theater troupes, motorcycles, etc. Is it even a parade without these?
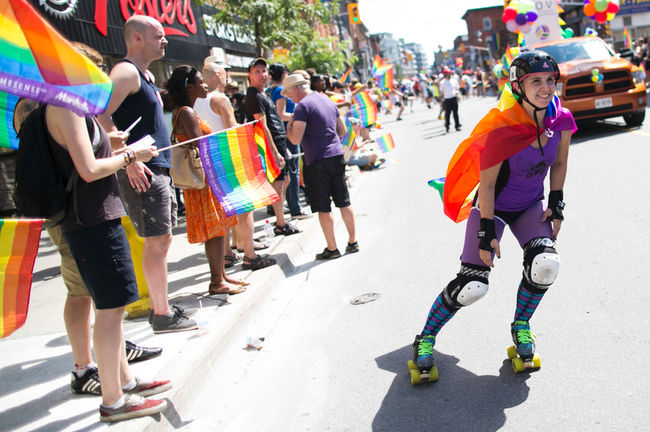
7 - 8 | Sports!!!
Whether it is an LGBT league looking to recruit or a professional team looking to sell tickets, sports entities are usually fairly fun. Higher on the scale if the sport is parade-demonstrable (Derby girls skating or volleyball/rugby teams throwing around balls = Fun. Bowling club walking = Not-as-Fun)
4 - 6 | Parade Staples!
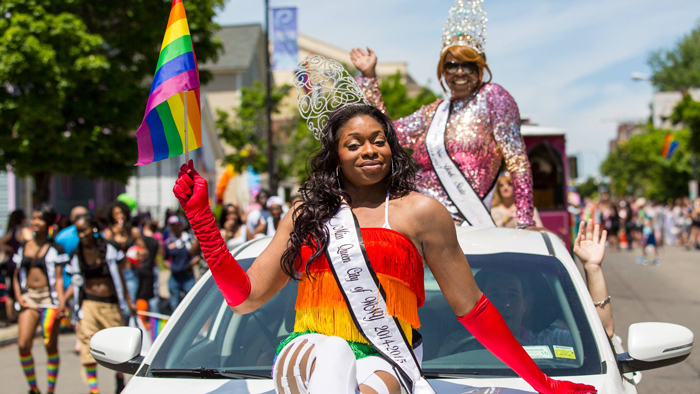
Starting to get to the not-so-fun entries, but parade staples can still be fairly exciting. Here we are talking your Kings and Queens (boring waving, but usually cool outfits), banners (usually big and colorful), and marshals (sometimes local celebrities). Entity fares lower on the fun scale if a donation bucket is involved.
4 - 6 | Education
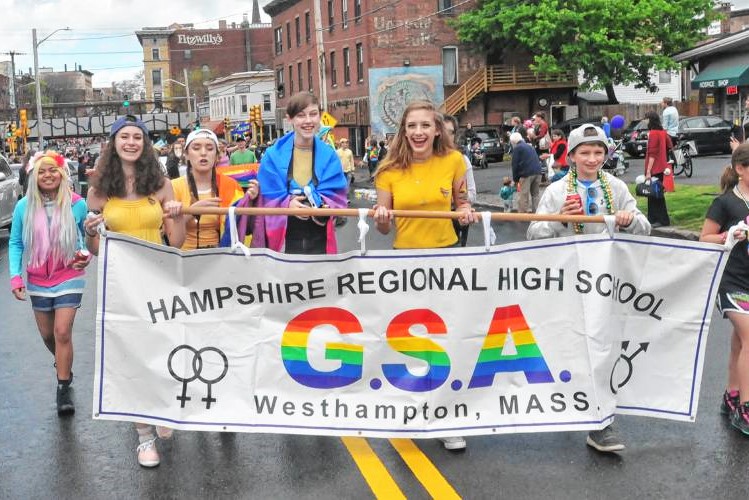
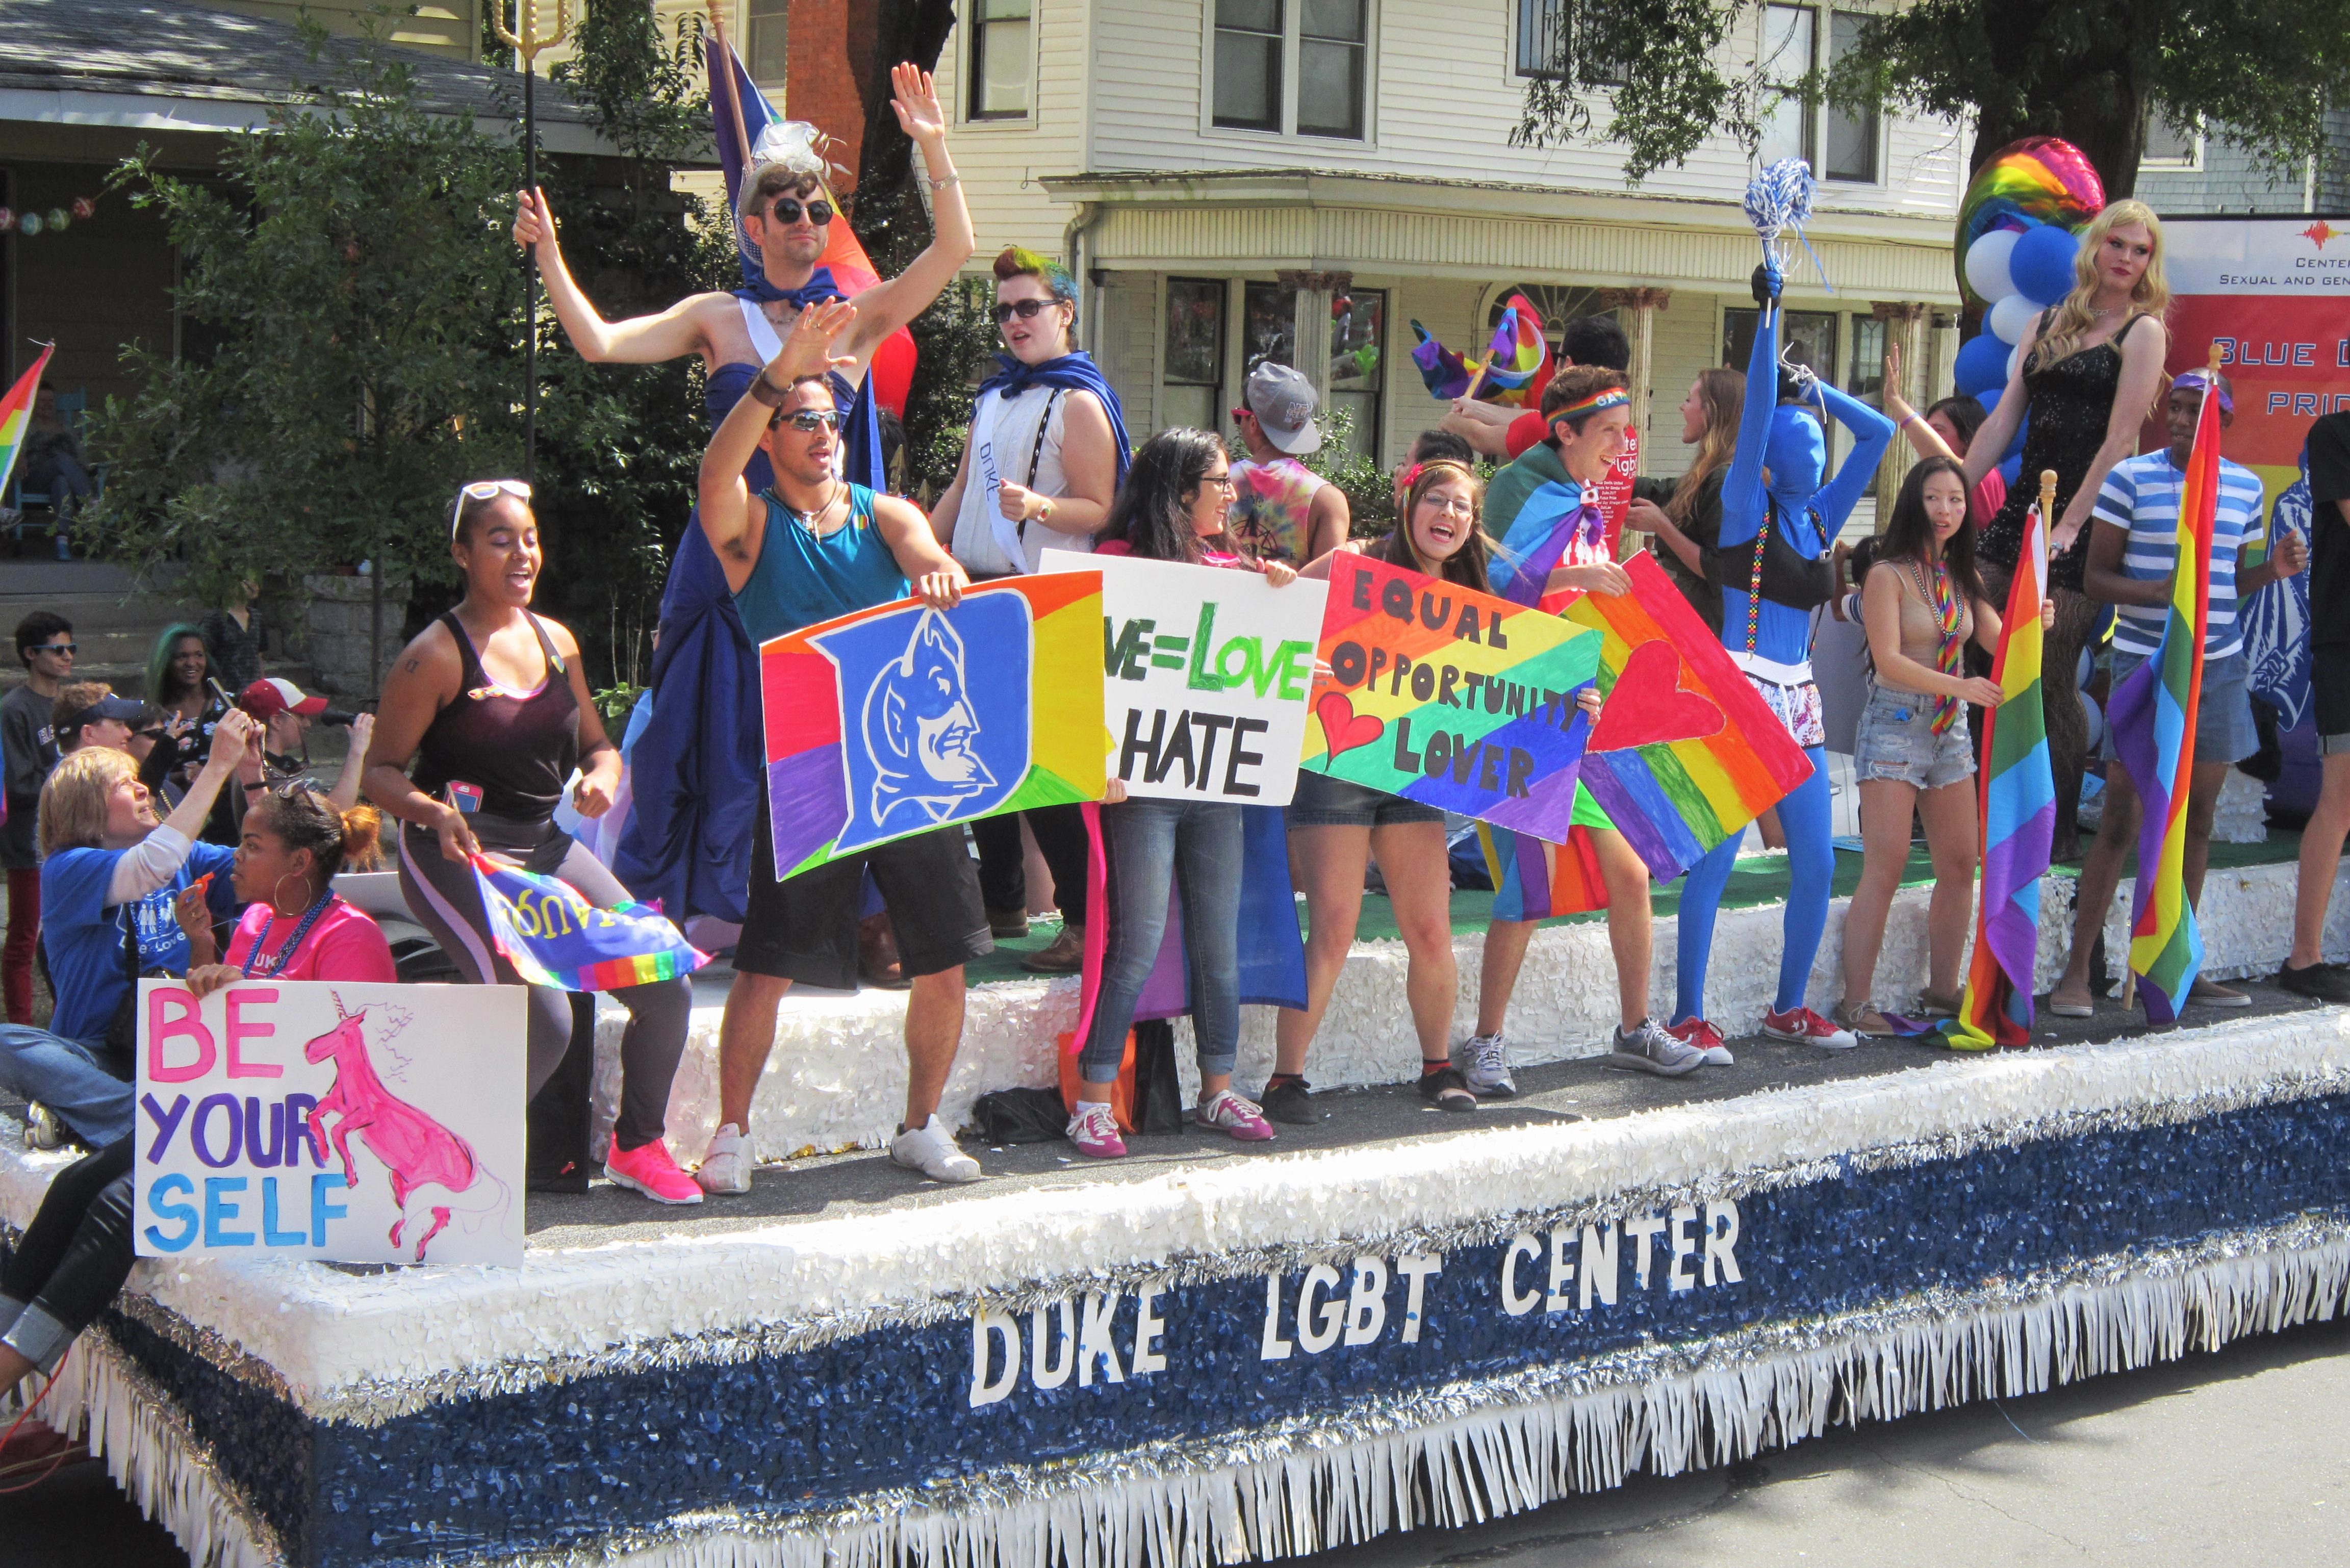
Includes everything from fancy-pants Montessori preschools trying to recruit them gaybies (lower fun scores) to college and university LGBT club floats (higher fun scores) which sometimes feature nightclub-level costumes and dancing
3 - 4 | Community Organizations
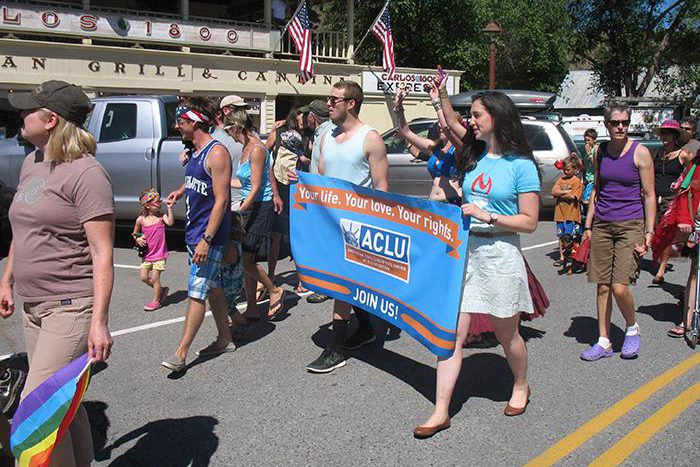
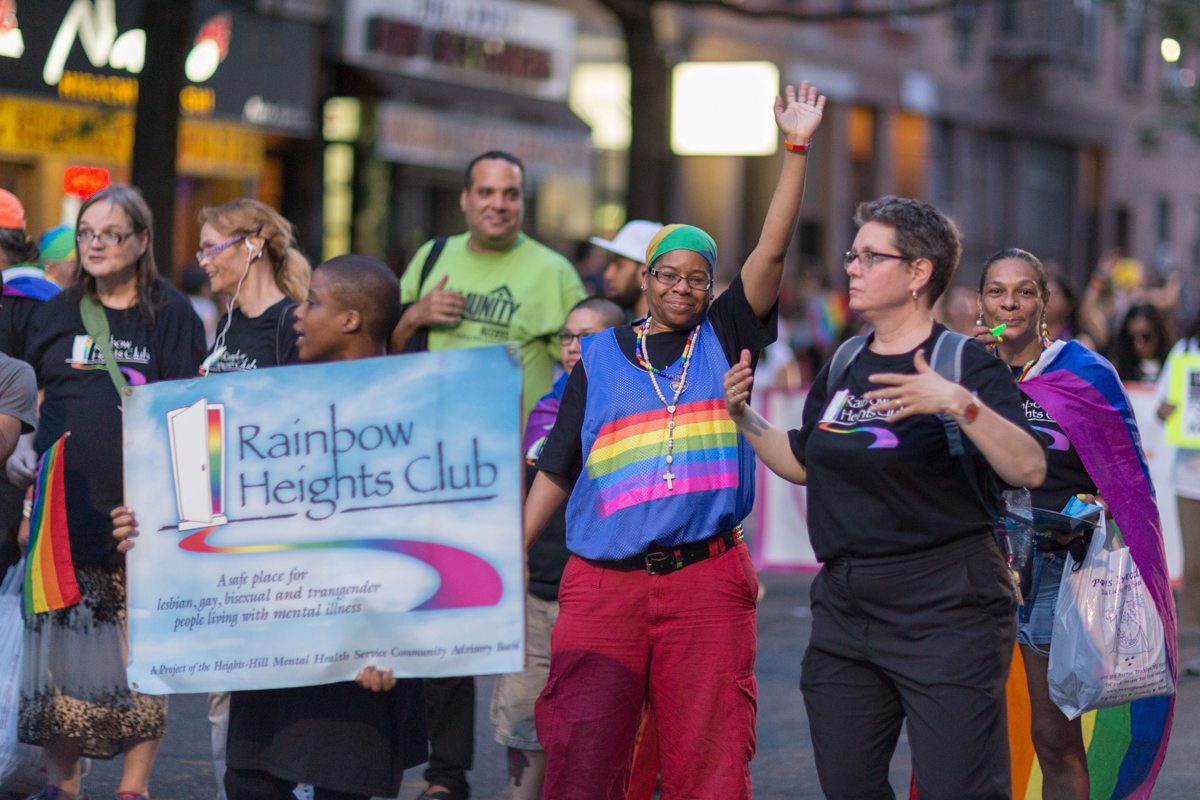
Broad category containing huge national non-profits (HRC, ACLU, etc) as well as local organizations for wide variety of causes (shelters, HIV testing, resource groups, meetups, you name it). While it is great to get information for organizations you are interested in, in general these are pretty boring. We’re talking sweaty volunteers with small banners and signs.
2 - 3 | Companies
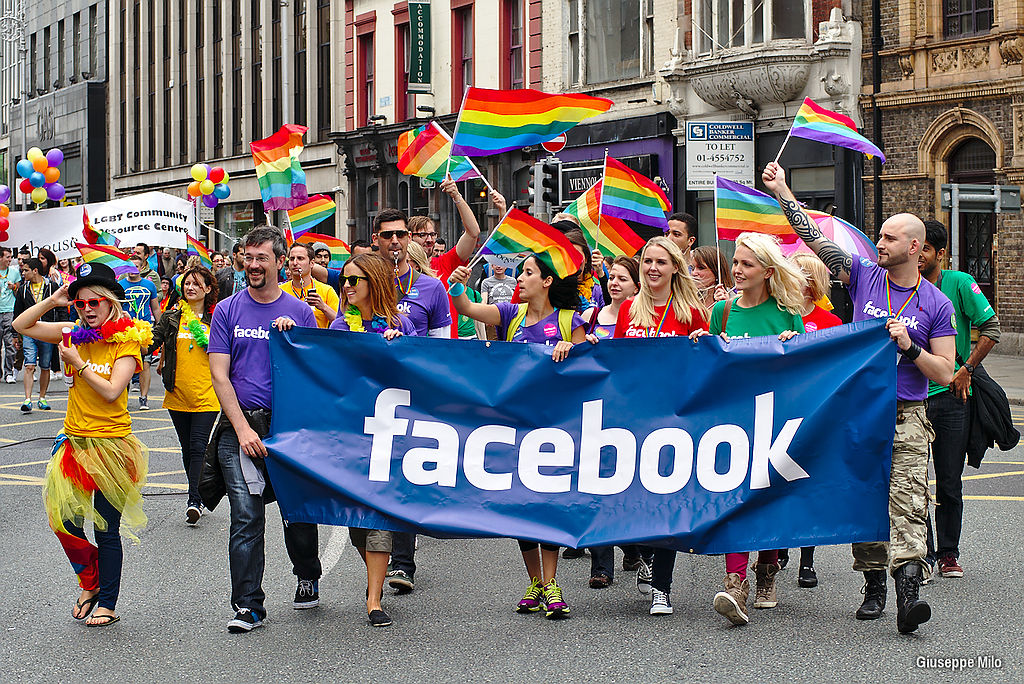
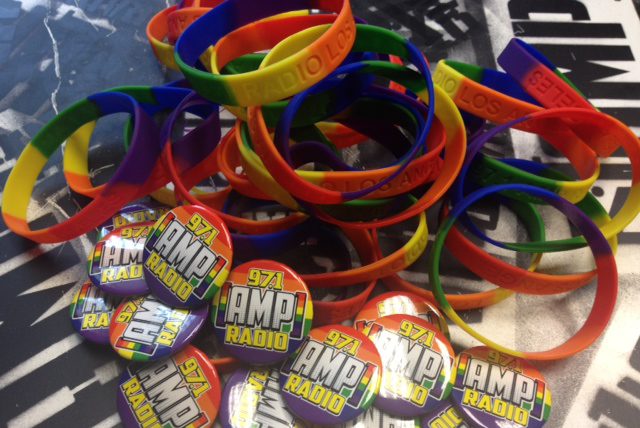
Depending on the amount and quality of corporate swag, companies can be ok. But, generally these entries are just hot and uncomfortable office employees walking and waving awkwardly. Not the most exciting thing to watch.
1 | Religious Organizations
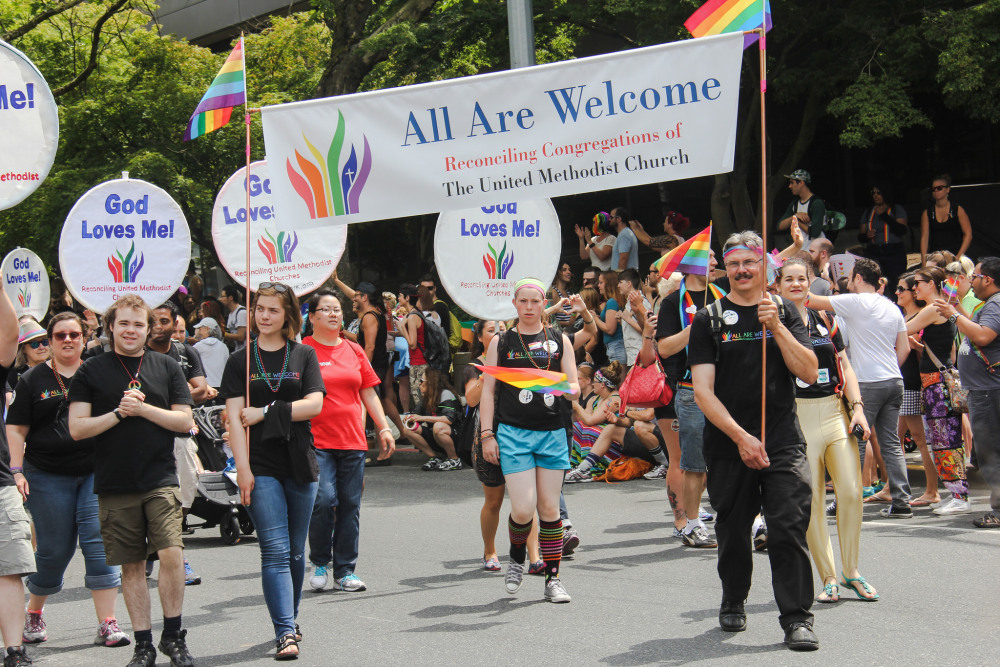
Includes somewhat scandalized church-goers with old candy selling Jesus. A for effort, but here come the pity cheers…
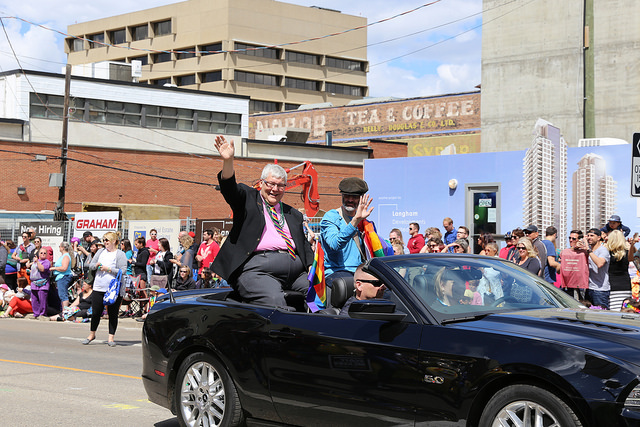
1 | Politicians
Worst of the worst when it comes to parade fun. Mr. Vote-For-Me in suit comes and shakes your hand or waves from the car while flyers with policy stances get shoved in your hand.
Pretty reasonable, right? I think so. If you have major disagreements with this scale it is probably a sign that this site, and most likely Pride, are just not gonna be your cup of tea...
Results!
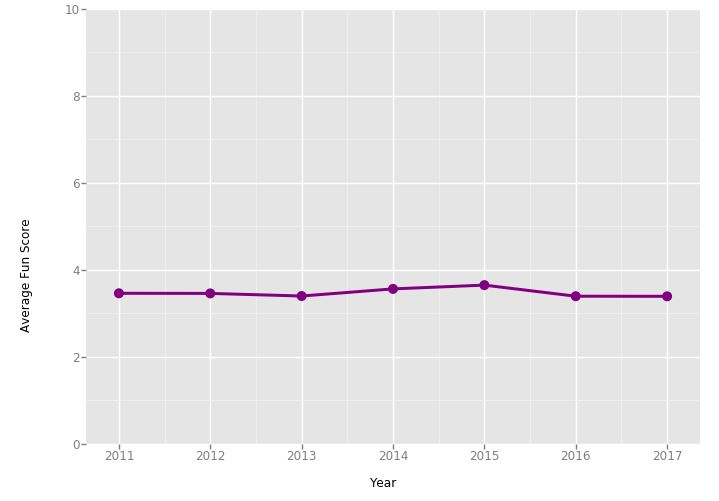
So, first pass at the data suggested this whole “pride is less fun” thing was all in my head... Turns out the average Gayta Science “Fun Score” is pretty steady through the years:
Average Parade Gayta Science Fun Score Over Time
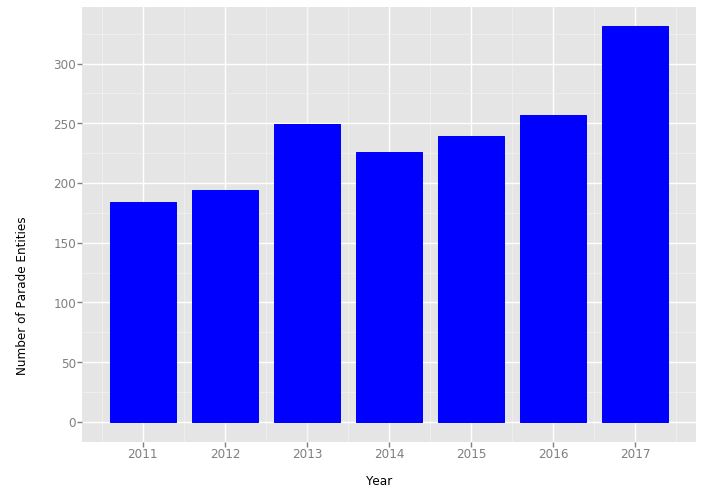
However, it would take a bit more evidence for me to start blaming myself. We also have to consider that the parades have gotten a hell of a lot longer through the years! The chart below shows this increase - 2011 saw 184 entries, while 2017 spectators had to sit through 331 different groups!
Parade Length Over Time
Notice again from the first chart that the overall fun score for any year sits around 3.5. So we are talking about parade experiences that are overall just slightly more fun than a community organization! This isn’t good, people! Need a reminder of what that looks like?
Riveting…. And nowadays we are sitting through parades that are almost twice as long as they were 6 years ago! It’s not just me being old and grumpy! Whew, sanity checks out, this time.
Let’s take a look at the Gayta Science “Fun Score” distributions of each parade over time:
Gayta Science Fun Score Distribution of Parades Over Time
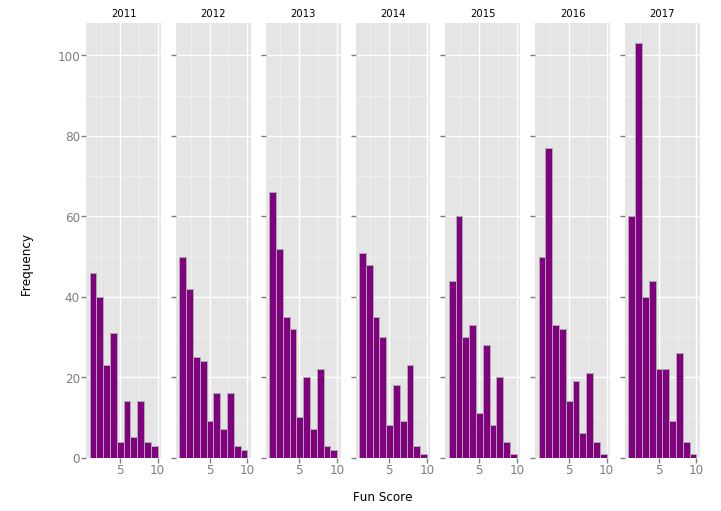
We can see that all the parades, even the early ones, are right skewed - meaning they heavily load the boring entries. There are many more entities with lower fun scores (1’s and 2’s – our Politicians, Religious Organizations, Companies) than there are ones with higher scores. You can really see the explosion of corporate pride (2nd bar) in the later parades too. Over 100 company entities in 2017! That is a third of the parade!!! Even more disappointing is the simultaneous decline of the gold star entries of pride parades: Nightclubs (last bar). We go from having a handful in 2011-13 to only having a single token entry in the later years. Not a fair trade!
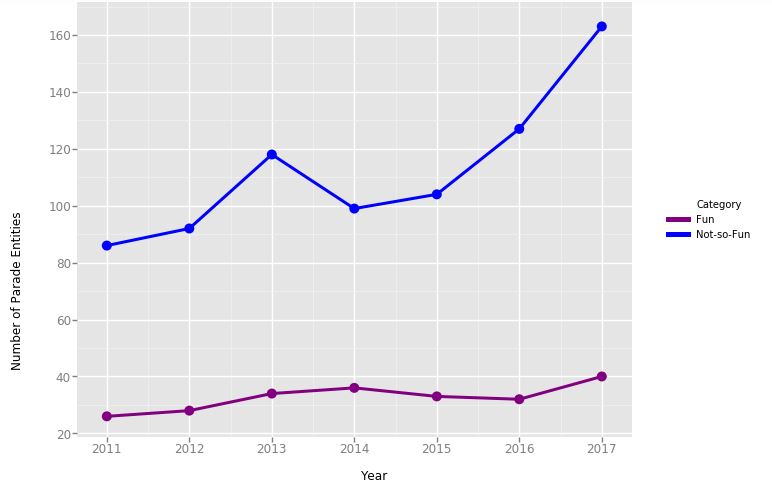
To illustrate this simply I considered only the most boring and most fun entries. I grouped entries with scores below 3 (Generally the Politicians, Religious Organizations, and Companies) and compared them to entities with scores 7 and above (Sports, Arts and Entertainment, Animals, and Nightclubs) over time. You can see from the chart below, fun entries have stayed pretty steady over time. Not-so-fun entries (mostly driven by corporations) have EXPLODED.
Fun vs Not-so-Fun Parade Entries Over Time
In all reality, this post is an extremely lighthearted take on a serious issue facing the community. I think that is both a reflection of my own privilege and tendency to get sarcastic about deeply troubling things that are out of my control. I talk here about “Fun”, but real conversations are happening about assimilation, inclusion, and corporatization in Prides and the LGBTQ+ equality movement in general. My favorite piece on this is here, but more recent commentaries from those protesting 2017 celebrations are also great to consider (here, and here, for starters).
But for now, as a takeaway to my now data-validated dilemma of Prides being less fun - a suggestion for all the politicians, companies, and churches crashing Pride celebrations. It’s great that as a whole the LGBTQ+ community is finally politically and economically worth your time and/or support for LGBTQ+ issues is now trendy enough for it to be rewarded! We’d rather have you with us than against us! Thanks for coming! However, you’re super dull and making Pride boring. Please consider a compromise:
Just a suggestion 🙂
Data Deets:
About the Author
Share this Post